- PENDLE’s price dropped by more than 5% in the last 24 hours.
- Technical indicators looked bearish on the token.
PENDLE has come a long way over the past 30 days as its value surged by triple digits. Such sudden price hikes are often followed by sell-offs as investors choose to take an exit to earn profits, which results in price corrections.
PENDLE investors are enjoying profits
According to CoinMarketCap, investors witnessed a massive bull rally last month as the token’s value surged by more than 119%. The massive rise in price allowed investors to earn huge profits.
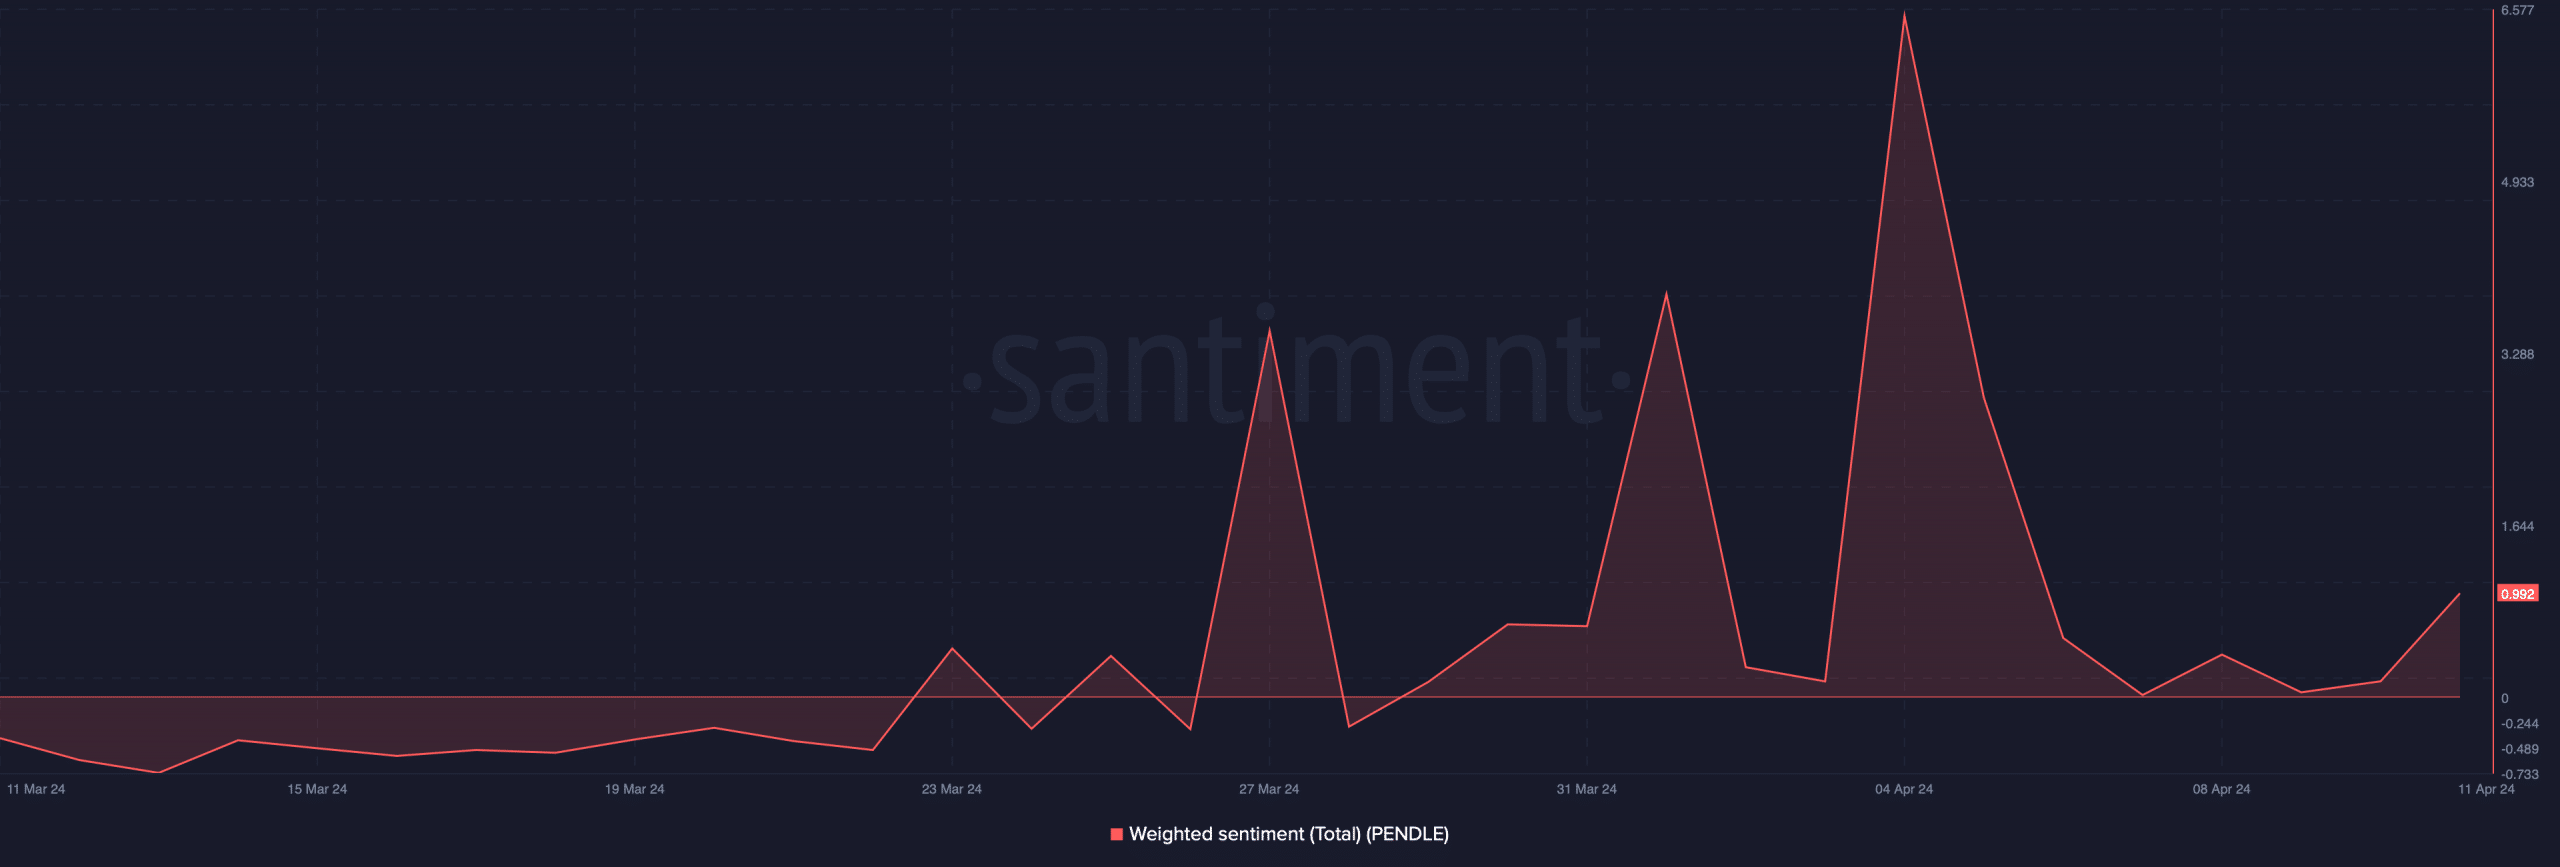
In fact, AMBCrypto’s look at IntoTheBlock’s data revealed that 100% of PENDLE investors were in profit. Thanks to that, bullish sentiment around the token remained high last month as its weighted sentiment graph was in the positive zone for multiple days.

Source: Santiment
Though this at first glance looked optimistic, the reality might be different. Since all investors were in profit, some might decide to take an exit by selling their holdings.
Lookonchain’s recent tweet pointed out a sell-off from a whale. As per the tweet, HashKey deposited 500,000 PENDLE, which was worth $3.54 million, to Binance. HashKey has a record of buying PENDLE at low prices and selling the token when its price pumps.
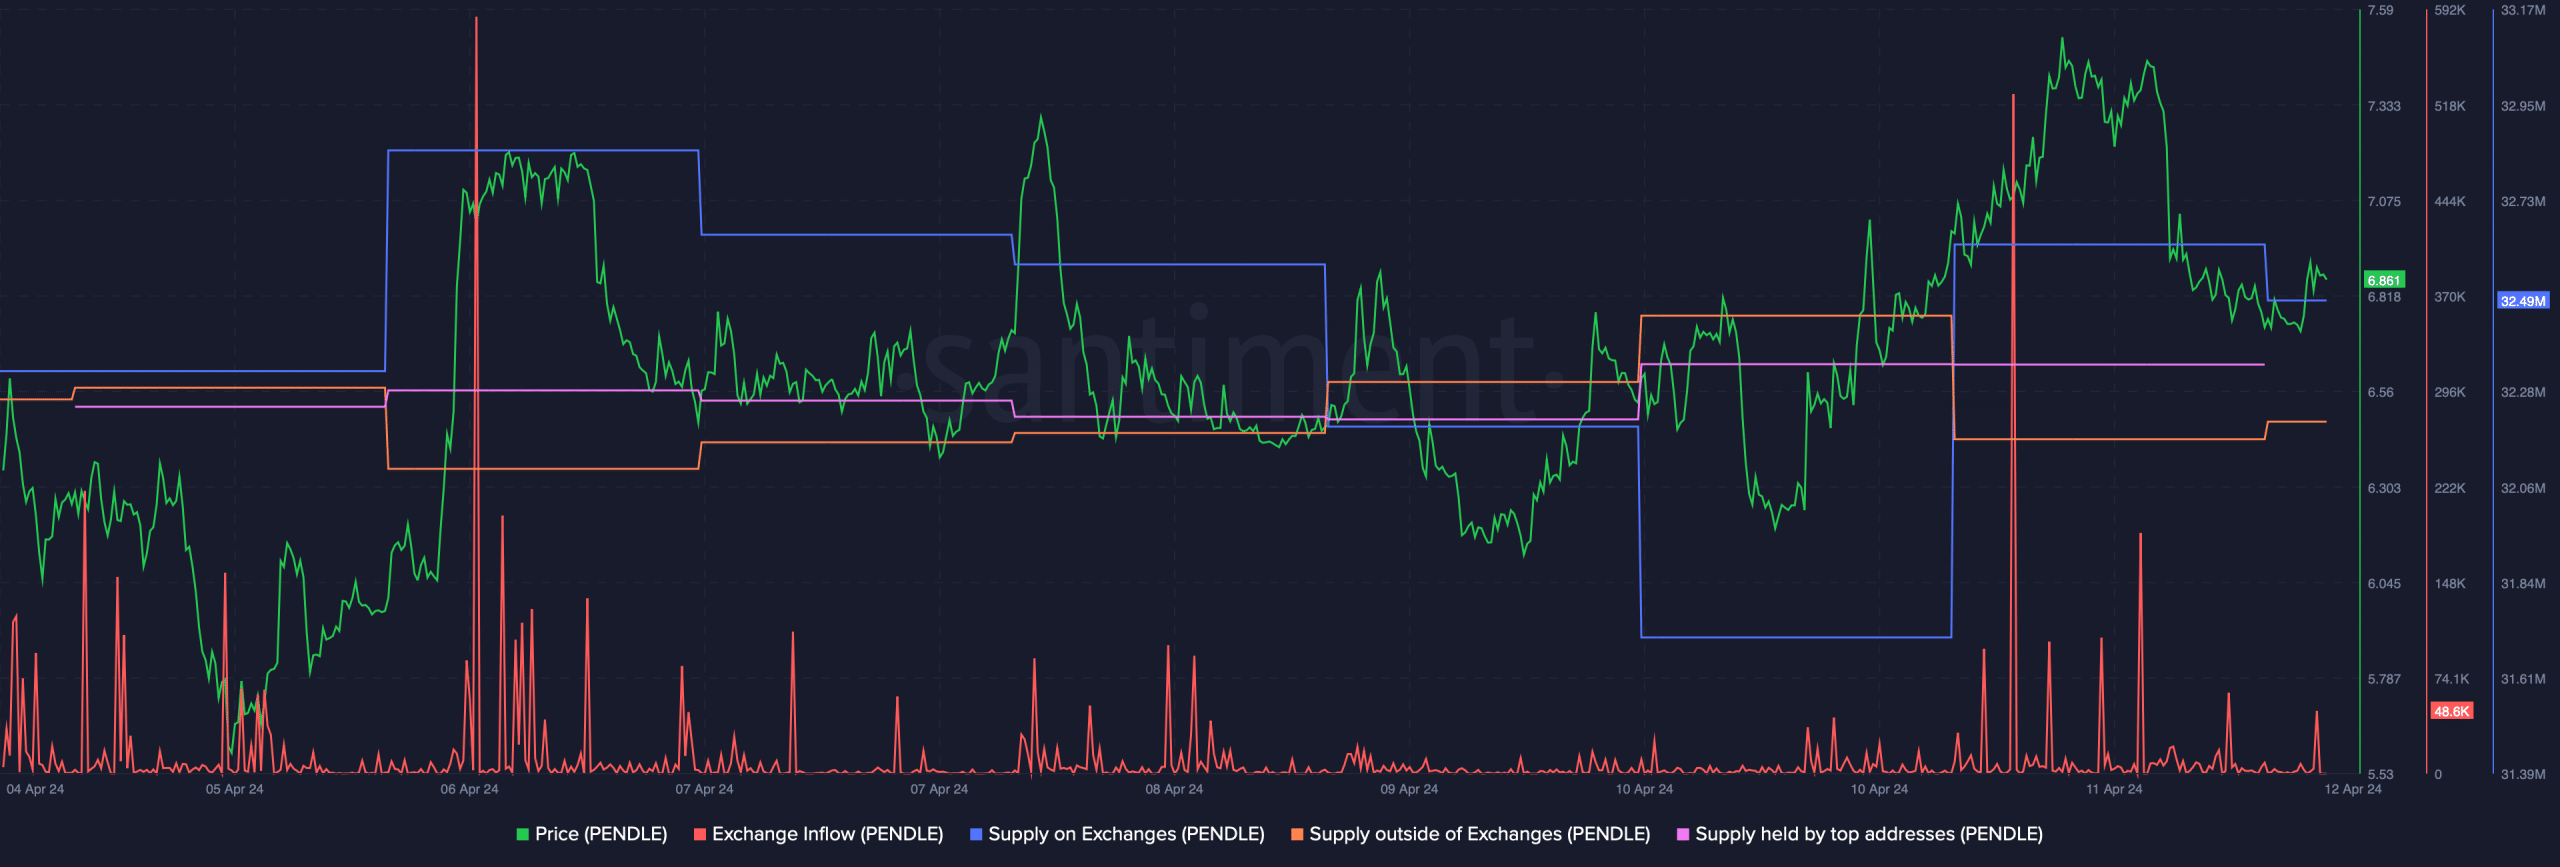
AMBCrypto then analyzed Santiment’s data to see whether selling pressure was dominant in the market. We found that the token’s exchange inflow surged substantially on the 11th of April, when its price spiked.
The fact that selling pressure was high was also proven by the token’s supply on exchanges, which increased while its supply outside of exchanges dropped.
However, the whales continued to accumulate as PENDLE’s supply held by top addresses increased slightly last week.

Source: Santiment
Is PENDLE’s bull rally ending?
The rise in selling pressure had a negative impact on the token’s price. In the last 24 hours alone, the token’s value plummeted by over 5%.
At the time of writing, it was trading at $6.69 with a market capitalization of over $1.6 billion. To understand whether the downtrend would continue further, AMBCrypto analyzed the token’s daily chart.
Realistic or not, here’s PENDLE market cap in BTC‘s terms
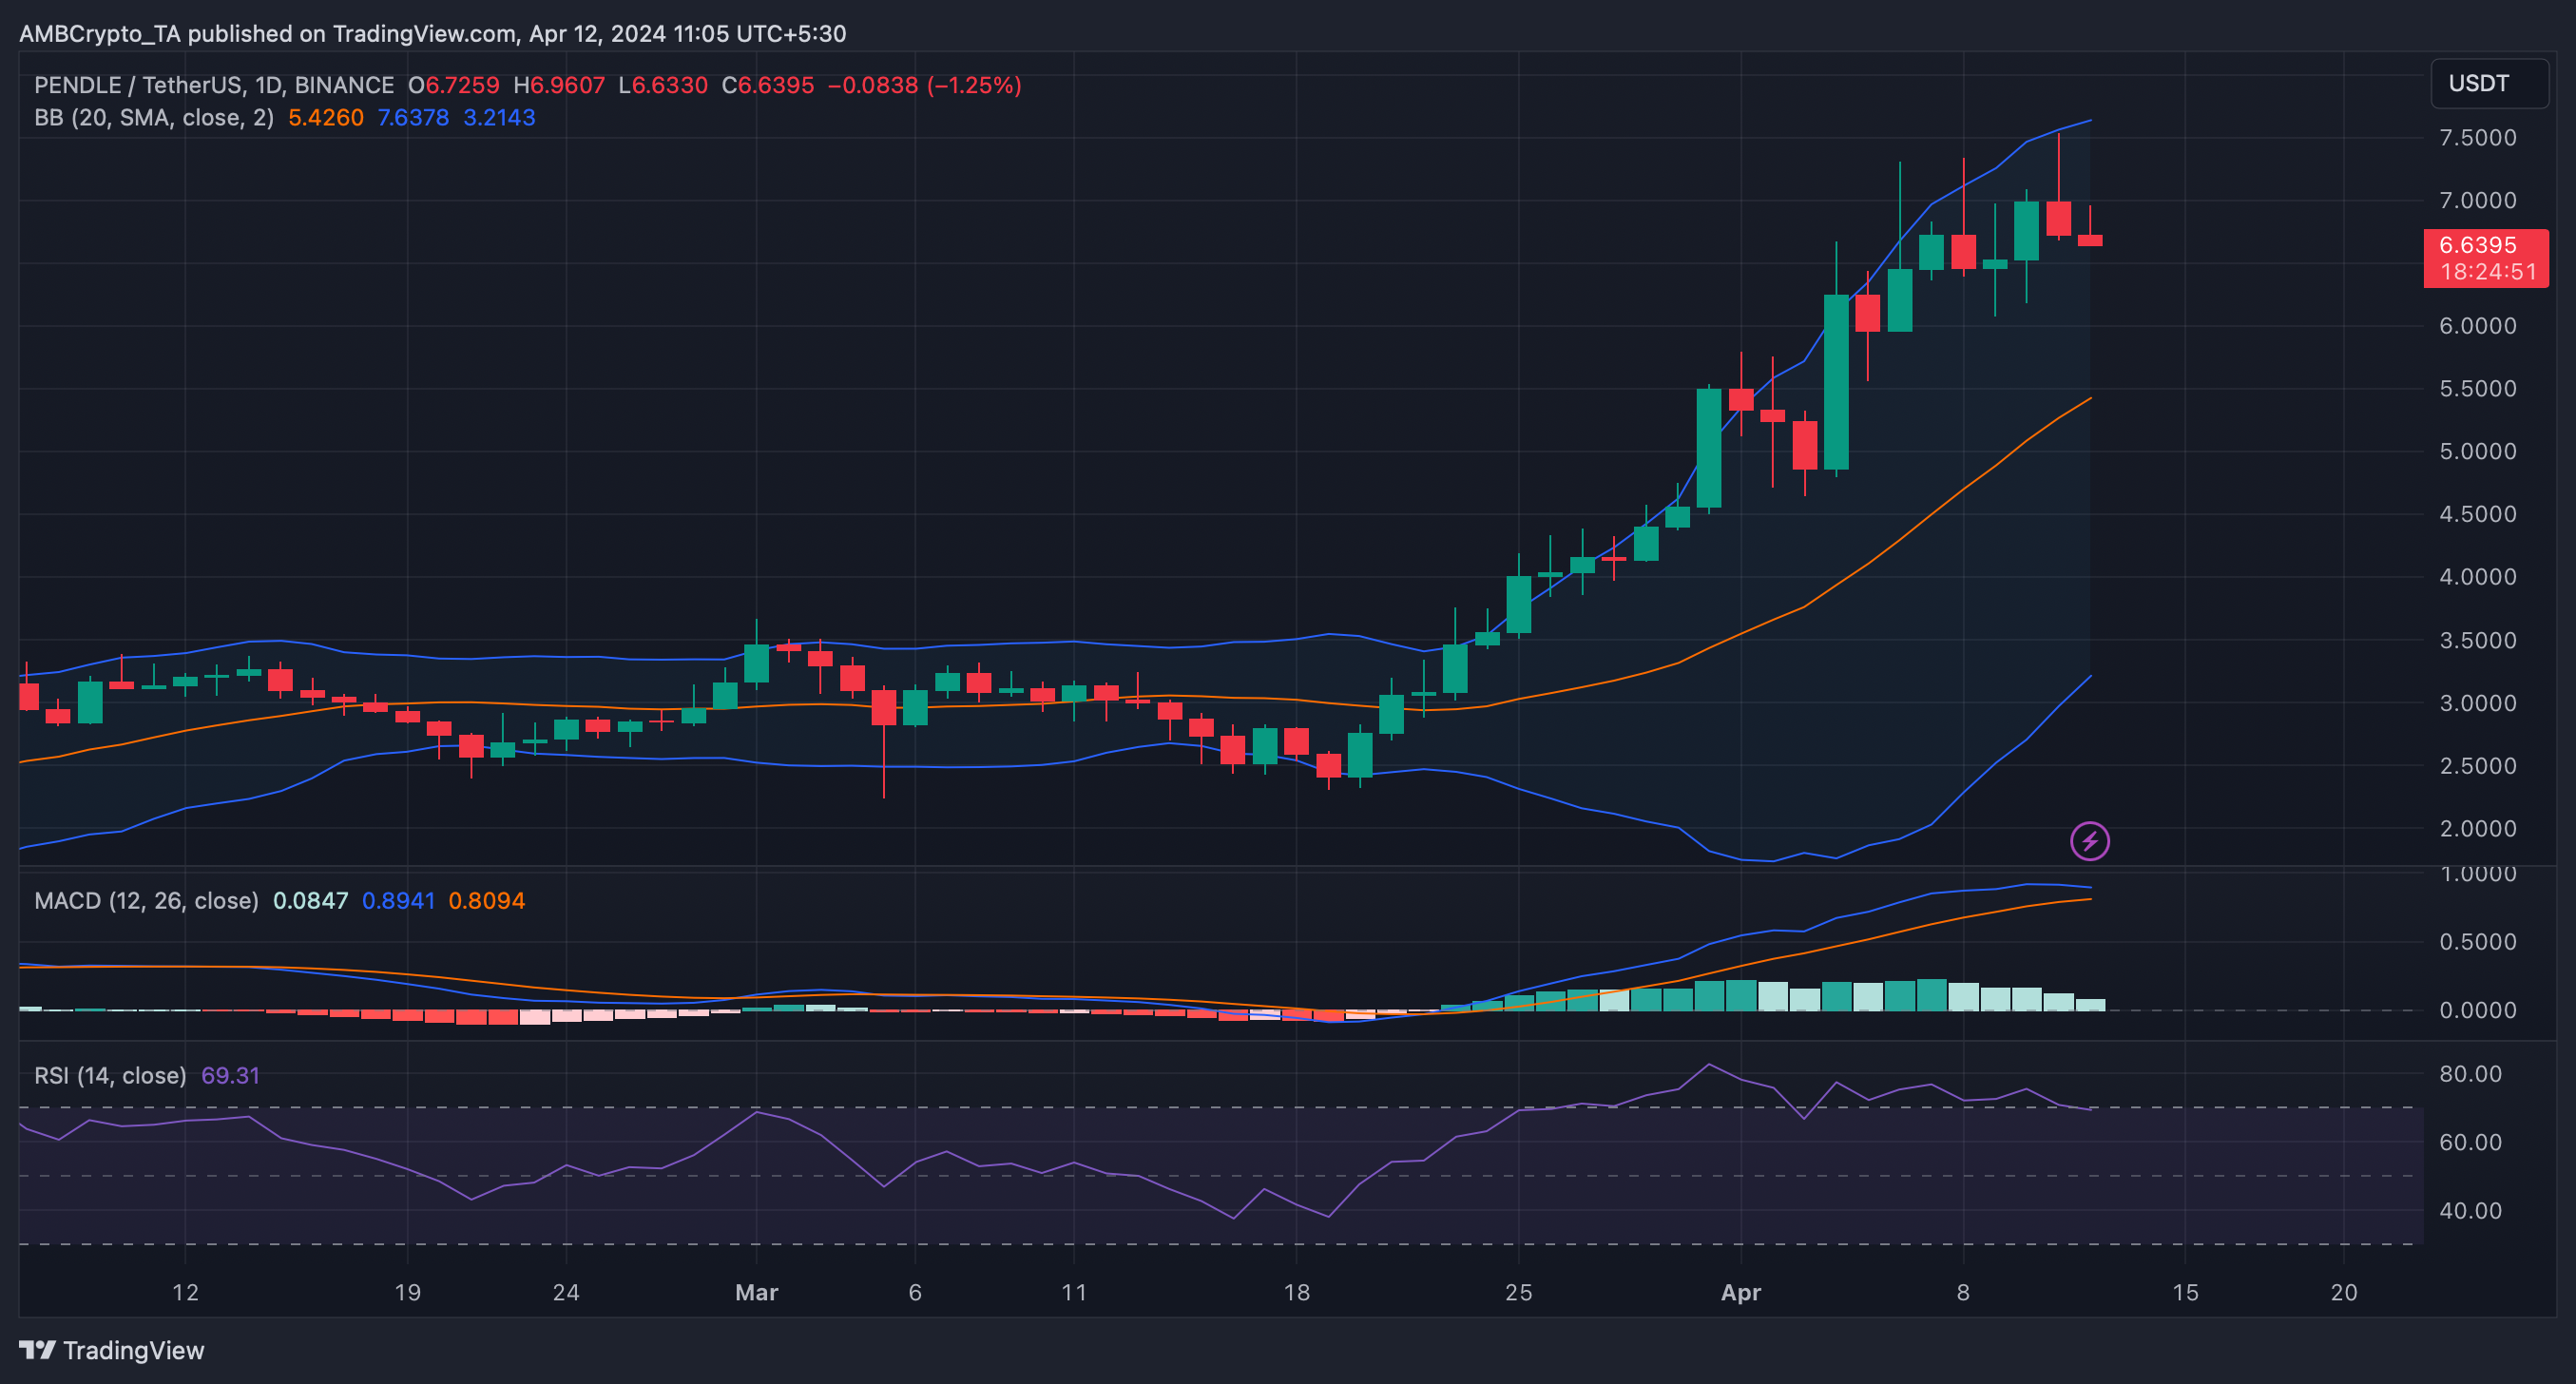
As per our analysis, PENDLE’s price was near the upper limit of the Bollinger Bands. Its Relative Strength Index (RSI) registered a downtick.
Additionally, the technical indicator MACD displayed the possibility of a bearish crossover. These indicators suggested that investors might witness a further drop in the token’s price before it again gains bullish momentum.

Source: TradingView
Powered by WPeMatico


