- WIF has recorded a significant decline in demand over the past week
- Low social activity confirmed the hike in bearish sentiments too
The value of leading memecoin dogwifhat [WIF] has cratered by double digits over the last 24 hours. In fact, this has contributed to the cryptocurrency ranking as the market’s biggest loser over that period, according to CoinMarketcap’s data.
Valued at $3.50, at the time of writing, WIF extended its weekly losses to fall by 14% over the aforementioned period.
More control for bears?
Following an extended period of rally, the month so far has been marked by a decline in WIF’s price. Here, it’s worth noting that over the weekly timeframe too, the altcoin’s value dropped by 13%.
This price fall mirrors the general decline in the memecoin market, which has caused the values of leading assets such as Floki [FLOKI] and Pepe [PEPE] to drop by 7% and 3%, respectively, over the same period too.
An assessment of WIF’s Futures market confirmed the growth in bearish sentiments. In fact, data from Coinglass revealed that the token’s Futures open interest has dropped by 29% since the beginning of April.

Source: Santiment
An asset’s Futures open interest measures the outstanding Futures contracts or positions that have not been closed or settled. When it falls in this manner, it suggests a drop in market activity and a change in sentiment among traders.
At press time, WIF’s Futures open interest was $444.43 million.
Confirming the decline in activity in WIF’s derivatives market, its Futures trading volume has also trended south since 1 April. Totaling $1.3 billion in the past 24 hours, it recorded a 9% decline during that period.
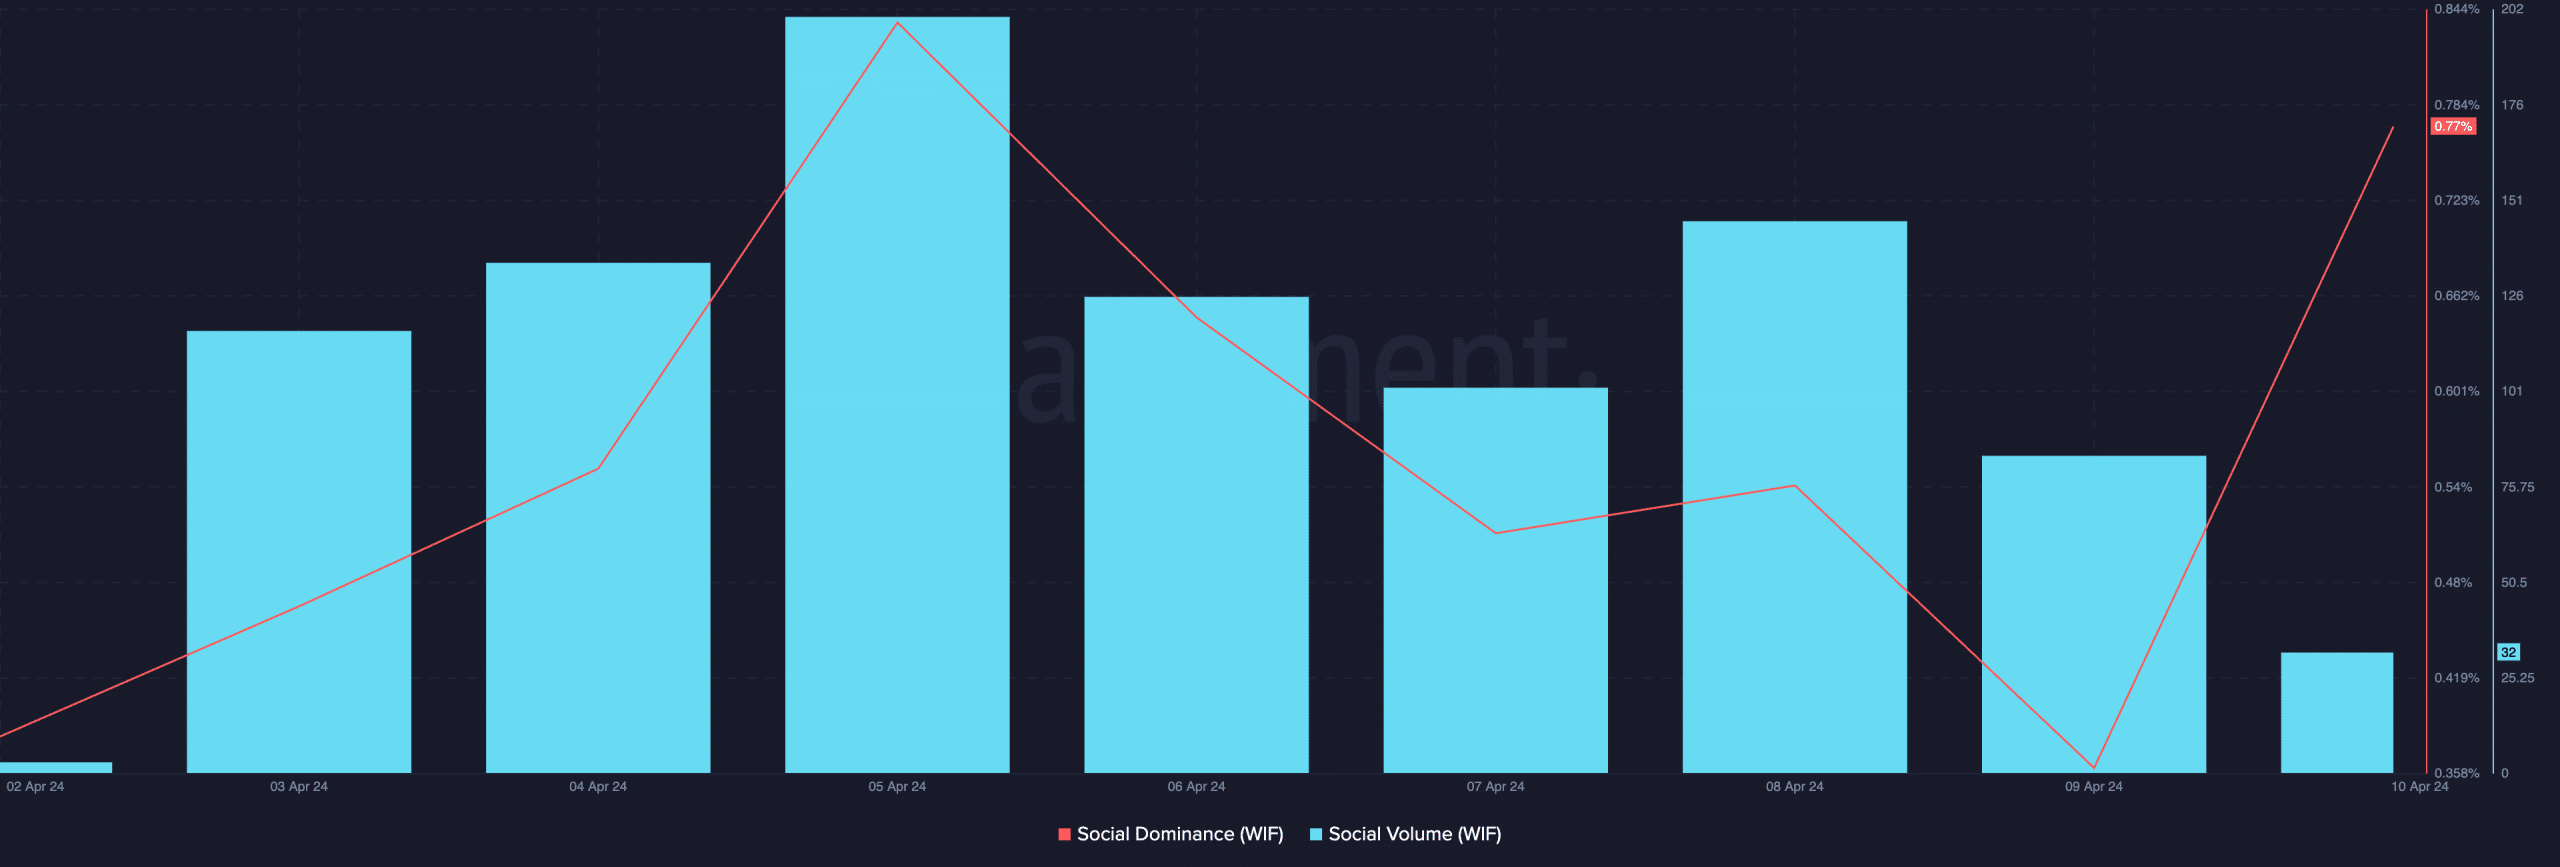
Furthermore, the memecoin’s social activity assessed on-chain underlined a fall in social media hype and mentions over the past week.
Additionally, according to Santiment’s data, WIF’s social dominance has dropped by 63% since 5 April, while its social volume dropped by 58%.

Source: Santiment
Realistic or not, here’s WIF’s market cap in BTC’s terms
Generally, a decline in an asset’s social activity over a period marked by surging bearish sentiments often confirms a continuation of the price decline.
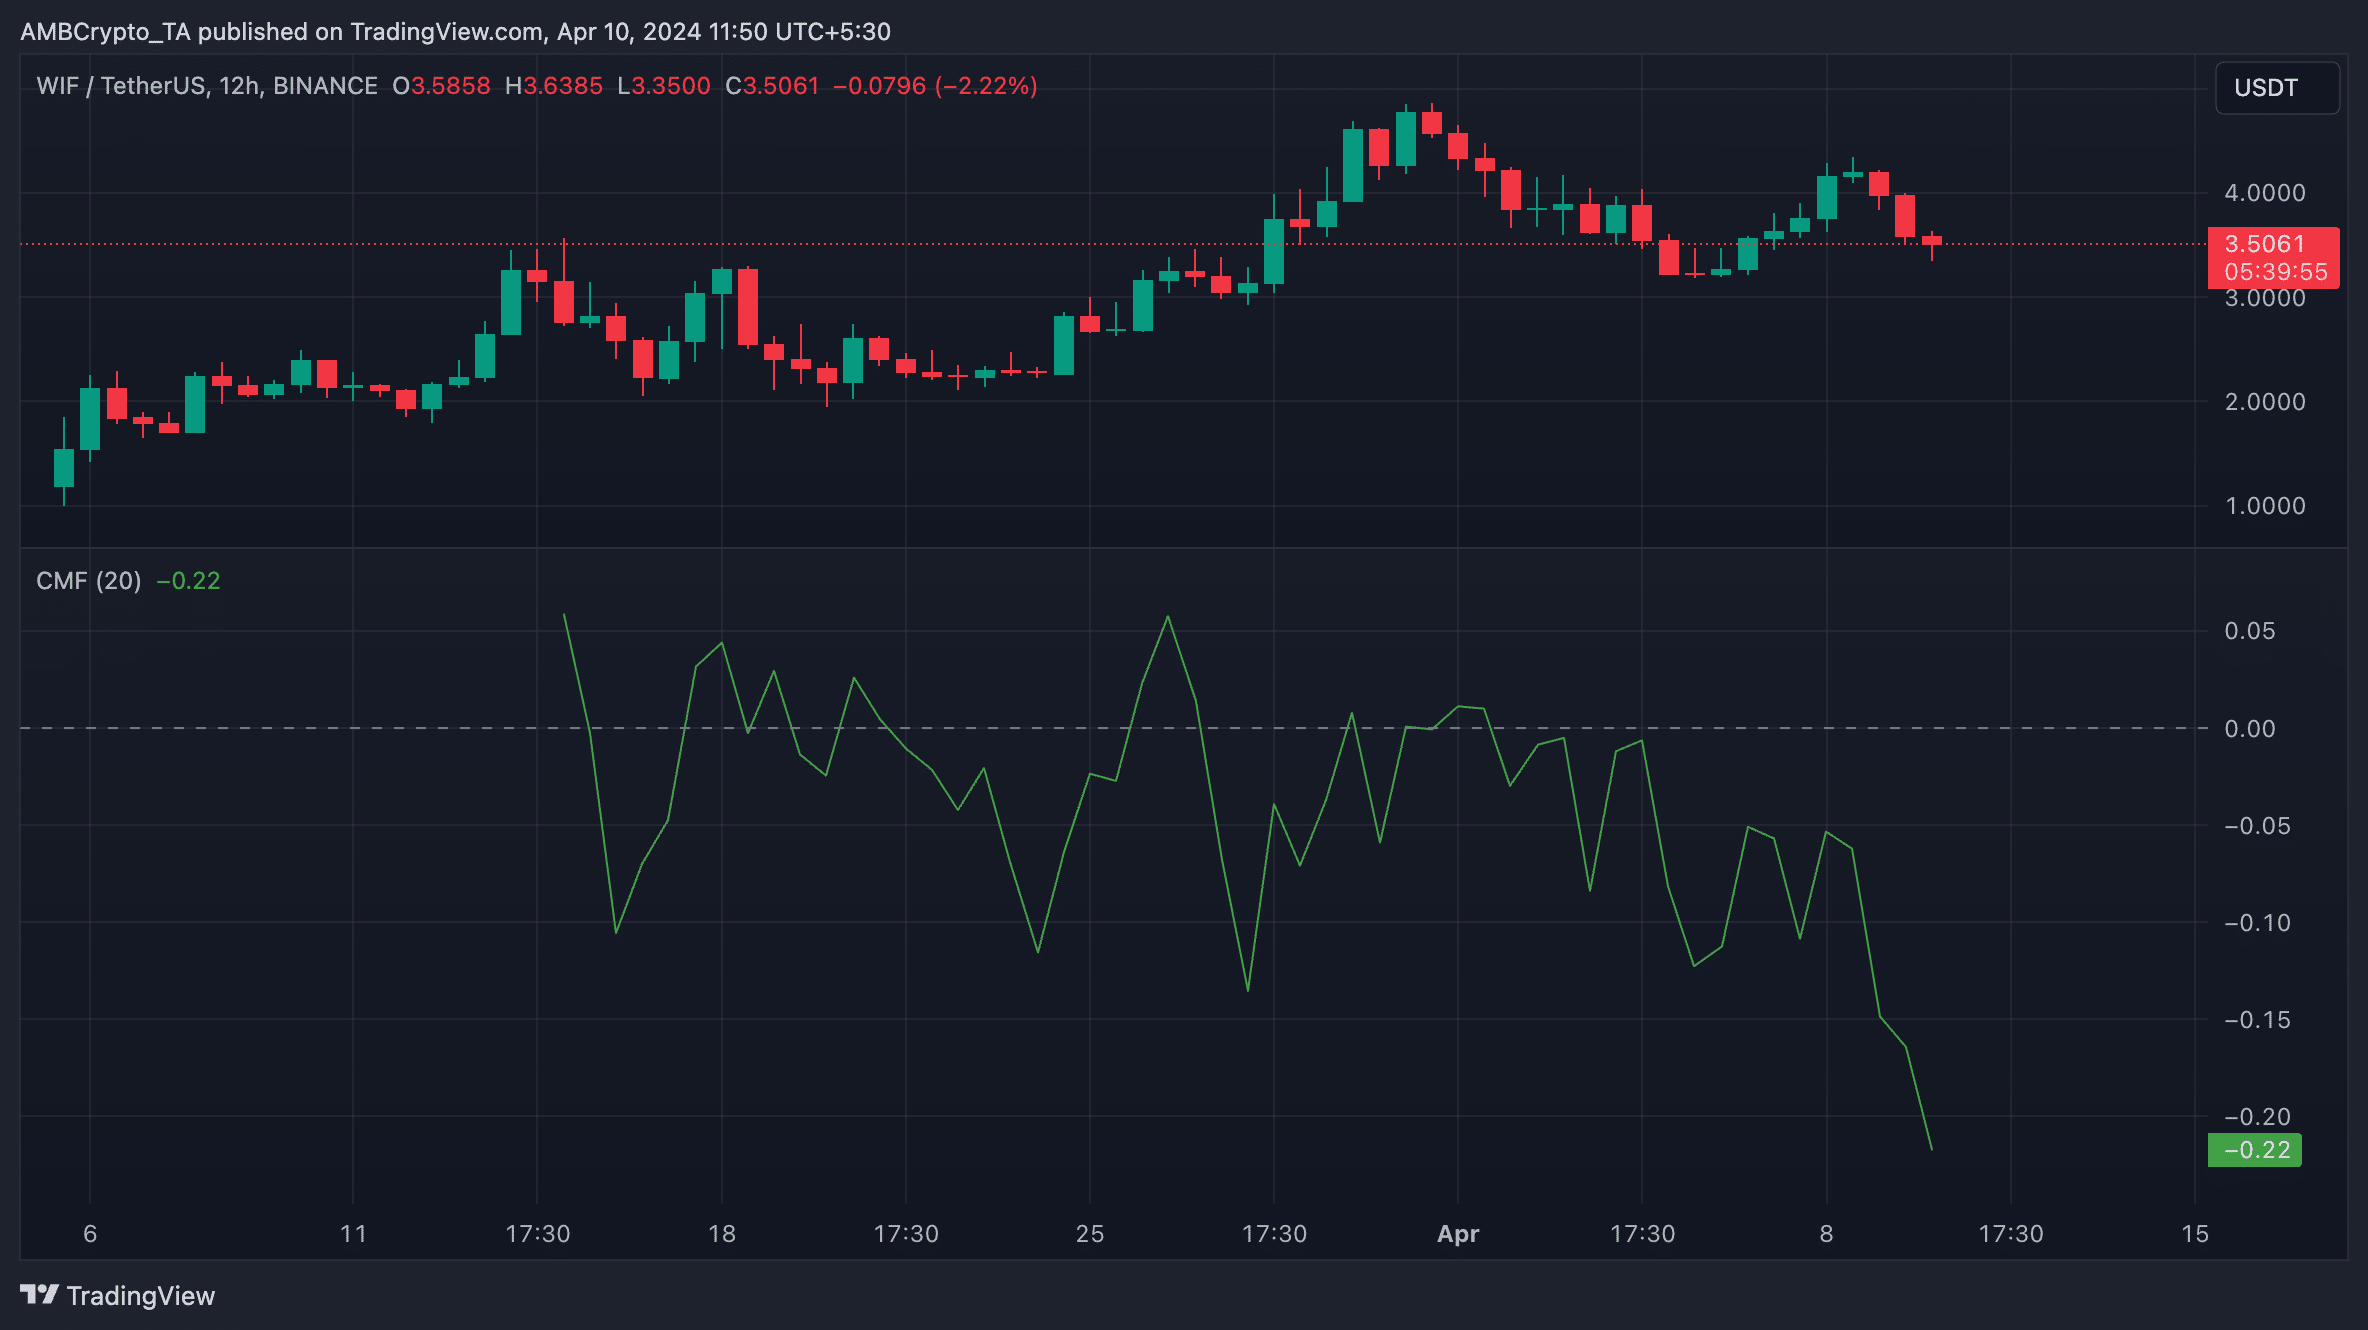
On its daily chart, the movements of key momentum indicators assessed on the 1-day chart showed liquidity exit from WIF’s spot market. For example, its Chaikin Money Flow (CMF) indicator, which measures the flow of money into and out of the asset, was negative at press time.

Source: WIF/USDT on TradingView
Trending downwards at -0.22, WIF’s CMF highlighted that its spot market participants have favoured sell-offs over accumulation.
Powered by WPeMatico


