- Cardano’s value dropped by more than 12% in the last seven days.
- Technical indicators like RSI looked bearish on the token.
As Bitcoin [BTC] remained bearish, most cryptos, including Cardano [ADA], got impacted by it. However, investors must not lose hope, as historical data suggests that the possibility of ADA initiating a bull rally is high.
If it happens again, then ADA might soon reach an all-time high.
Cardano bears are leading
The crypto market tends to follow Bitcoin, and since the king of crypto’s value plummeted under $66k, most crypto charts also turned red. Cardano was not an exception, as its value sank by more than 12% in the last seven days.
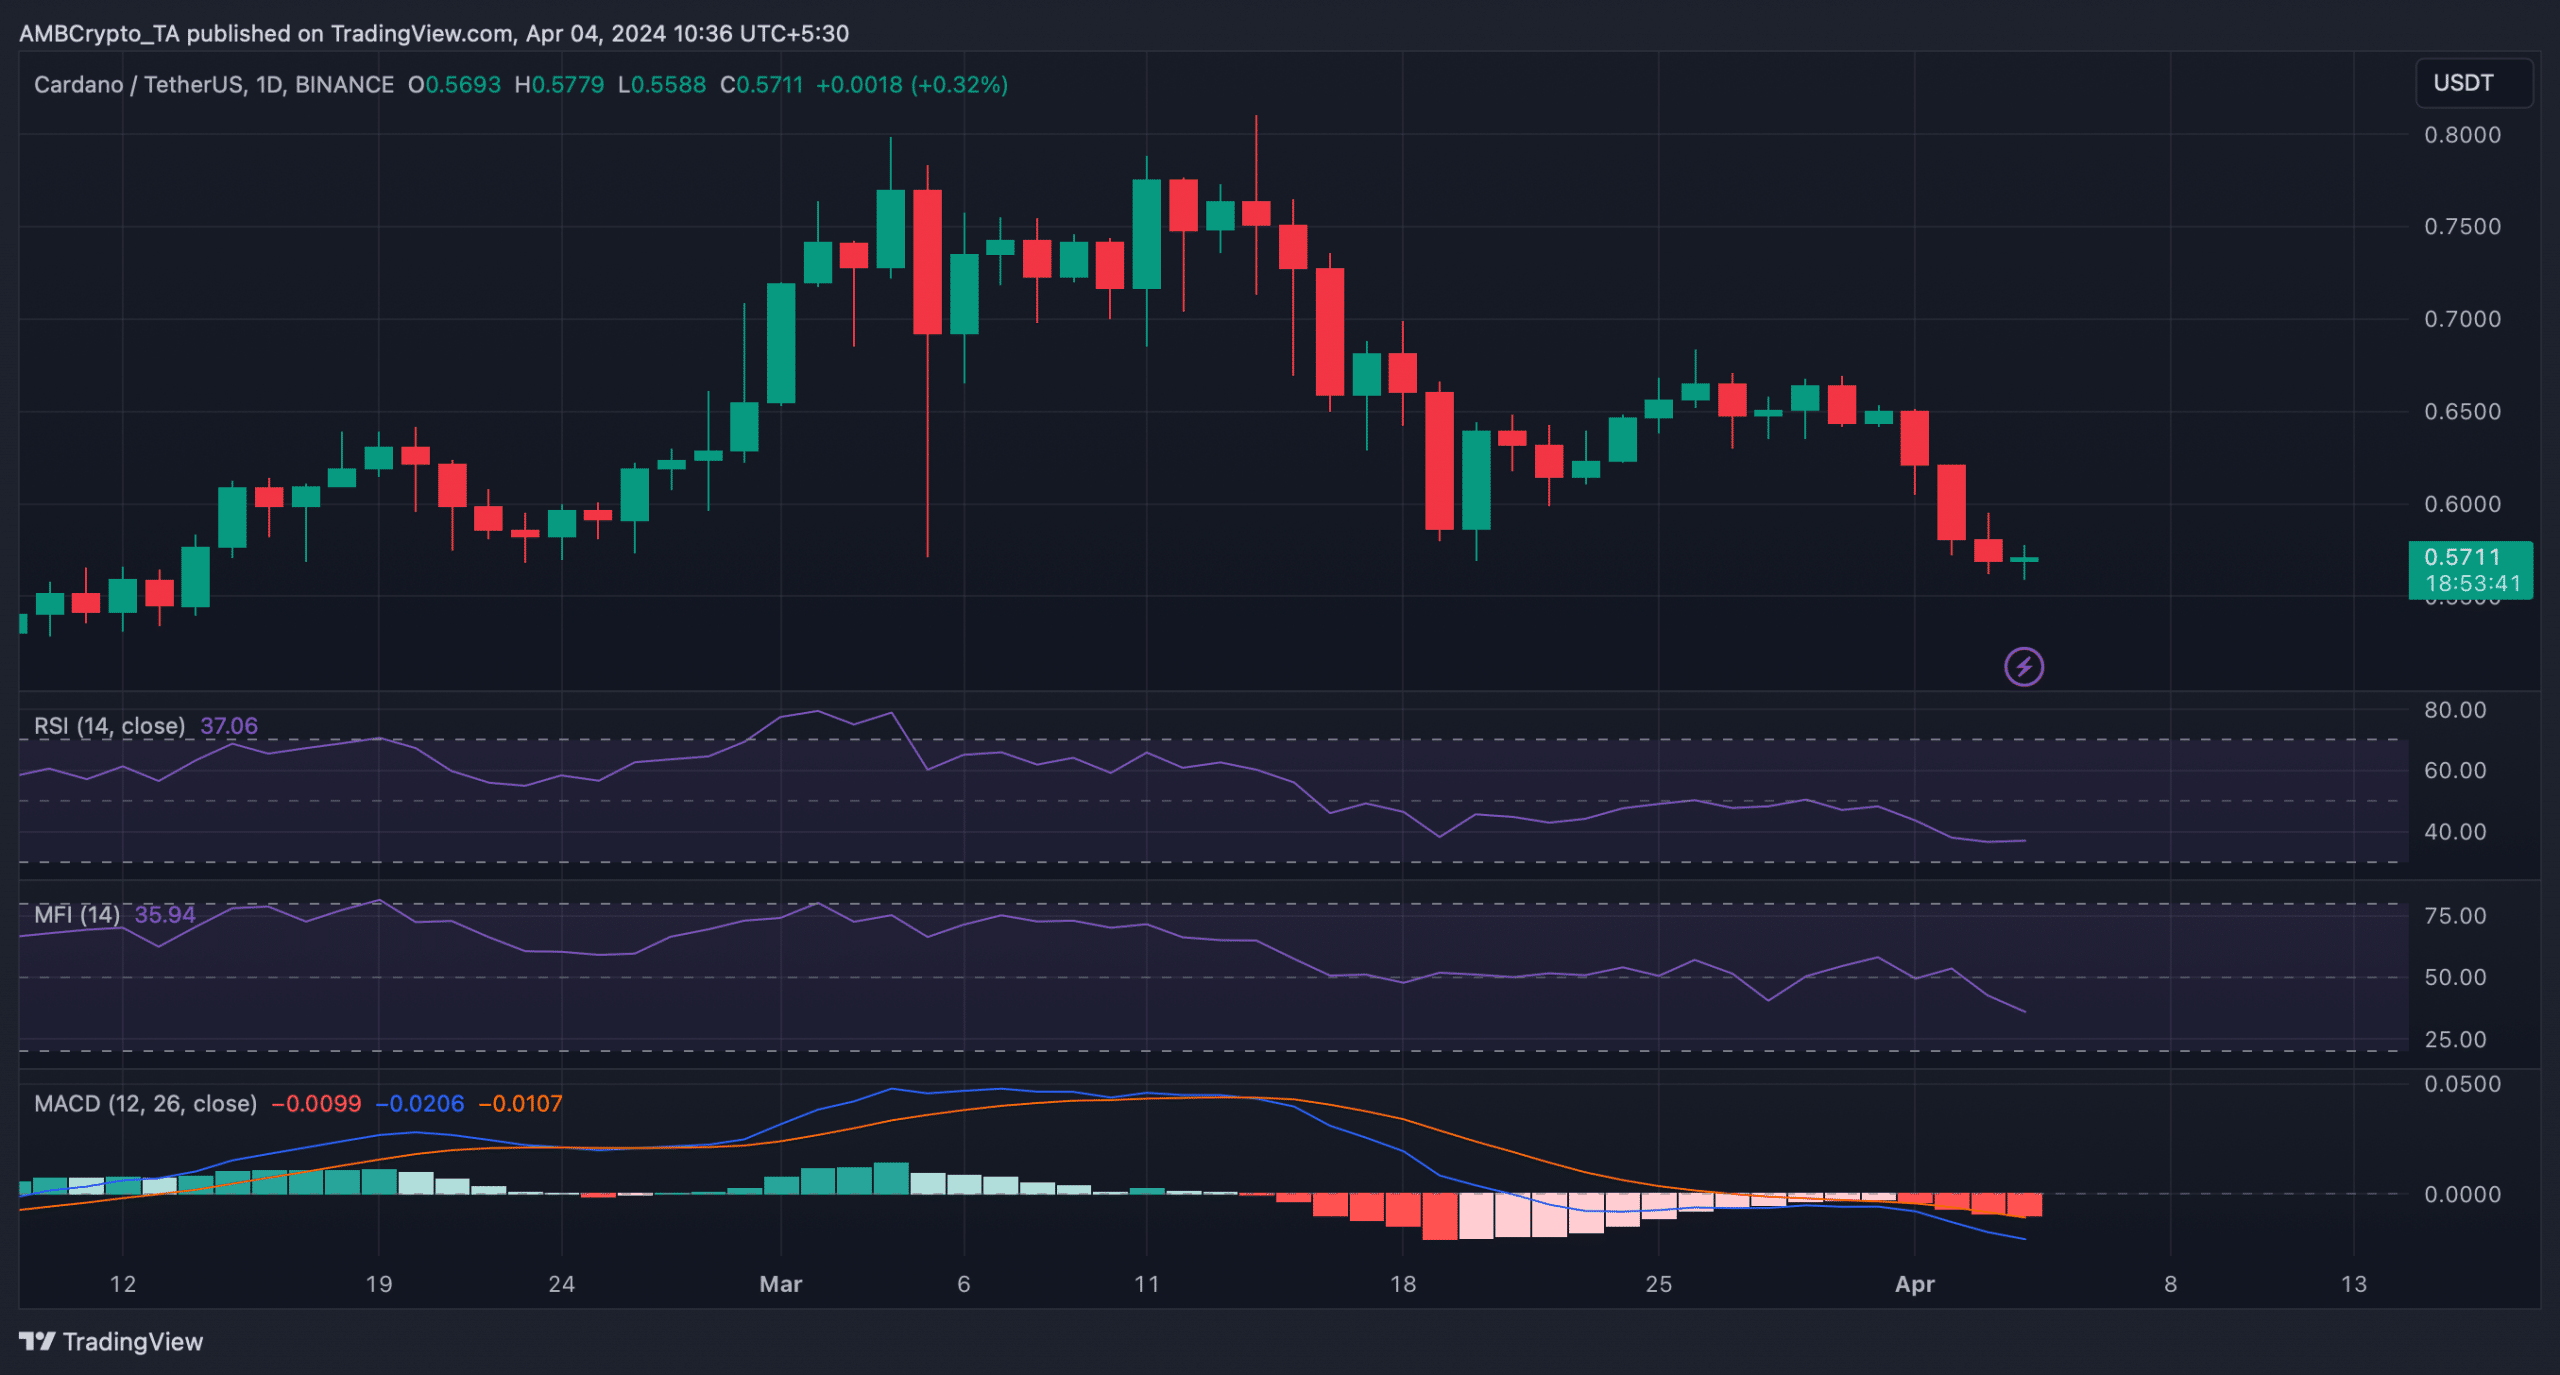
According to CoinMarketCap, in the last 24 hours alone, the token’s price dropped by over 3%. At the time of writing, ADA was trading at $0.5666 with a market capitalization of over $20 billion, making it the 9th largest crypto.
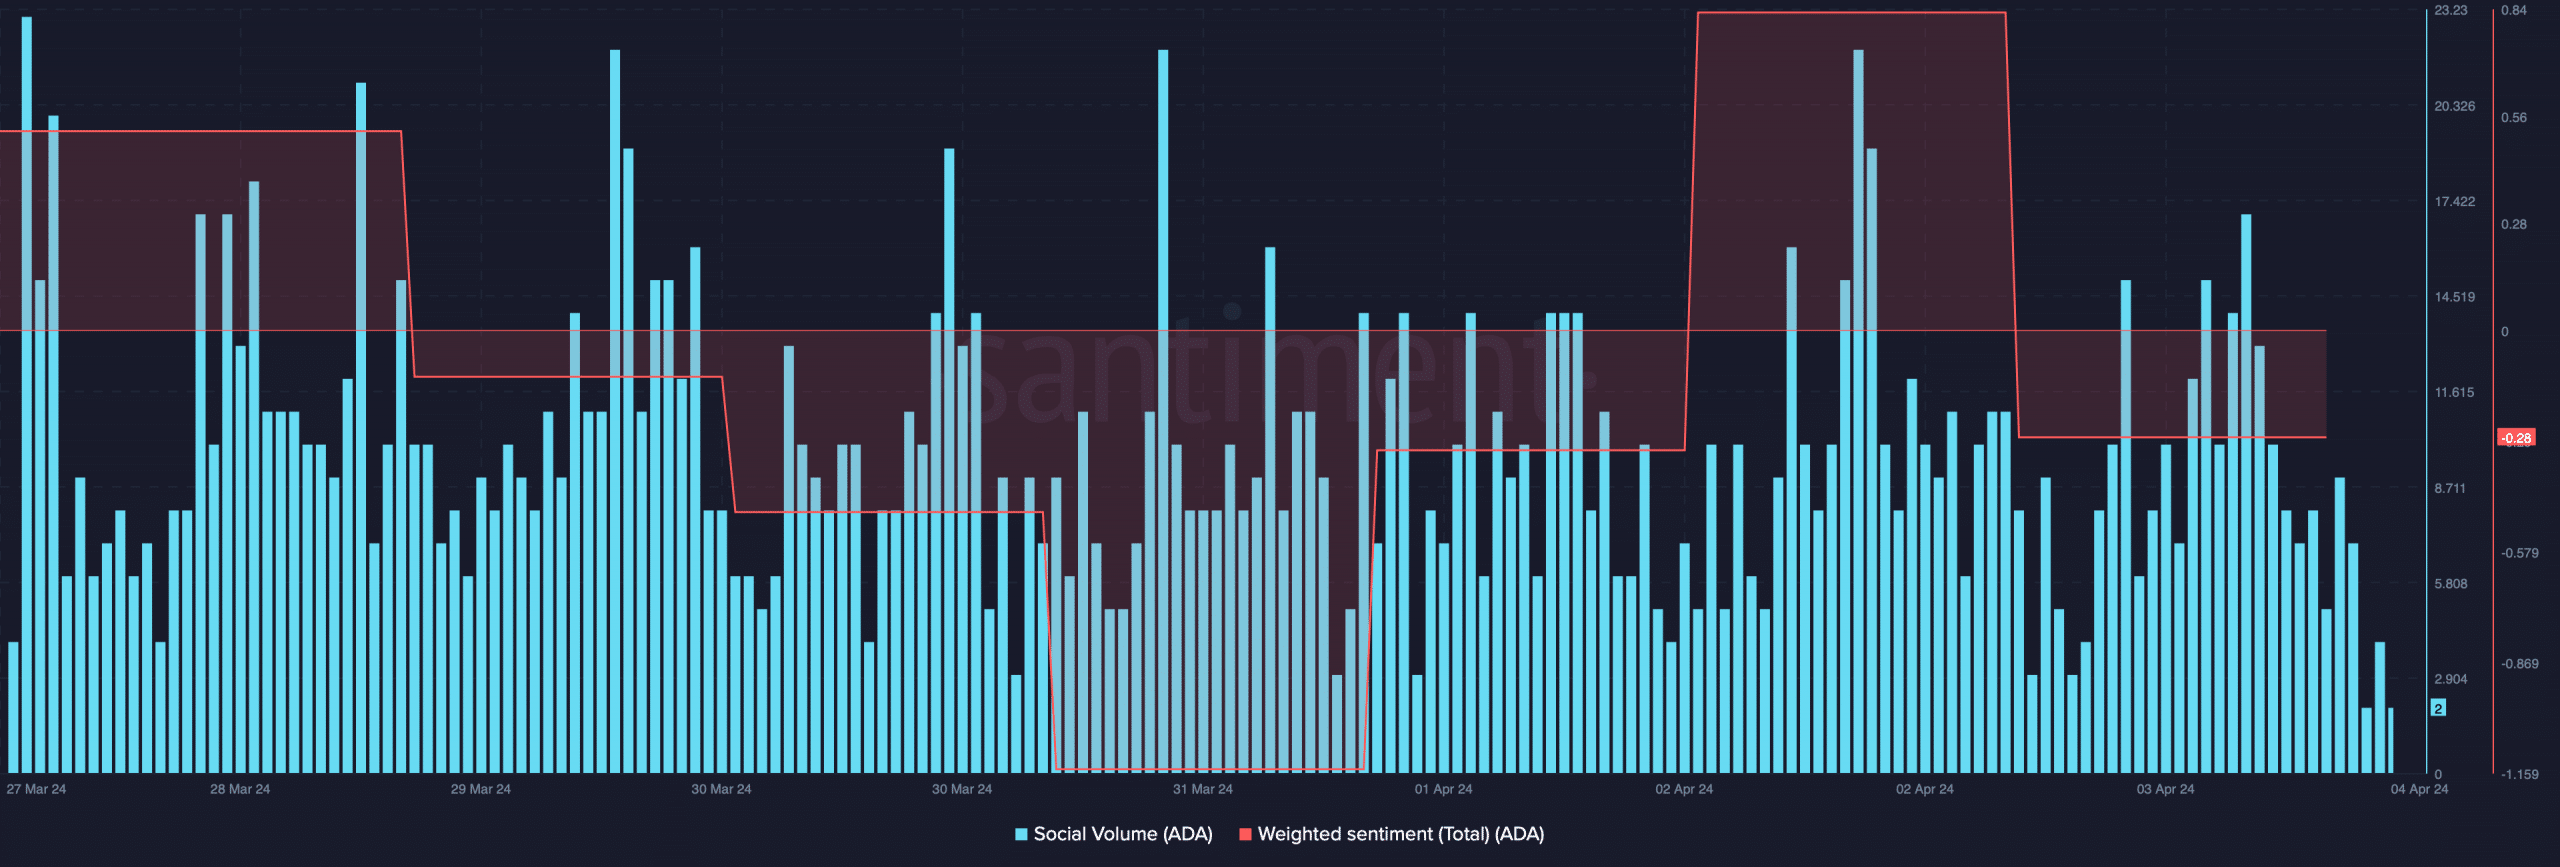
The drop in price had a negative impact on market sentiment. Our analysis of Santiment’s data revealed that ADA’s weighted sentiment dropped, meaning that bearish sentiment was dominant.
Nonetheless, its social volume remained high, reflecting its popularity in the crypto space.

Source: Santiment
Things might take a U-turn
In the meantime, Cardano Dapp Analyst, a popular ADA analyst, recently posted a tweet highlighting an interesting historical event. Last time when BTC’s price reached an ATH, ADA took 90 days more to follow the trend and to reach an ATH.
Since BTC’s price touched $73k a few days ago, if history repeats itself, then investors might witness ADA begin a bull rally soon.
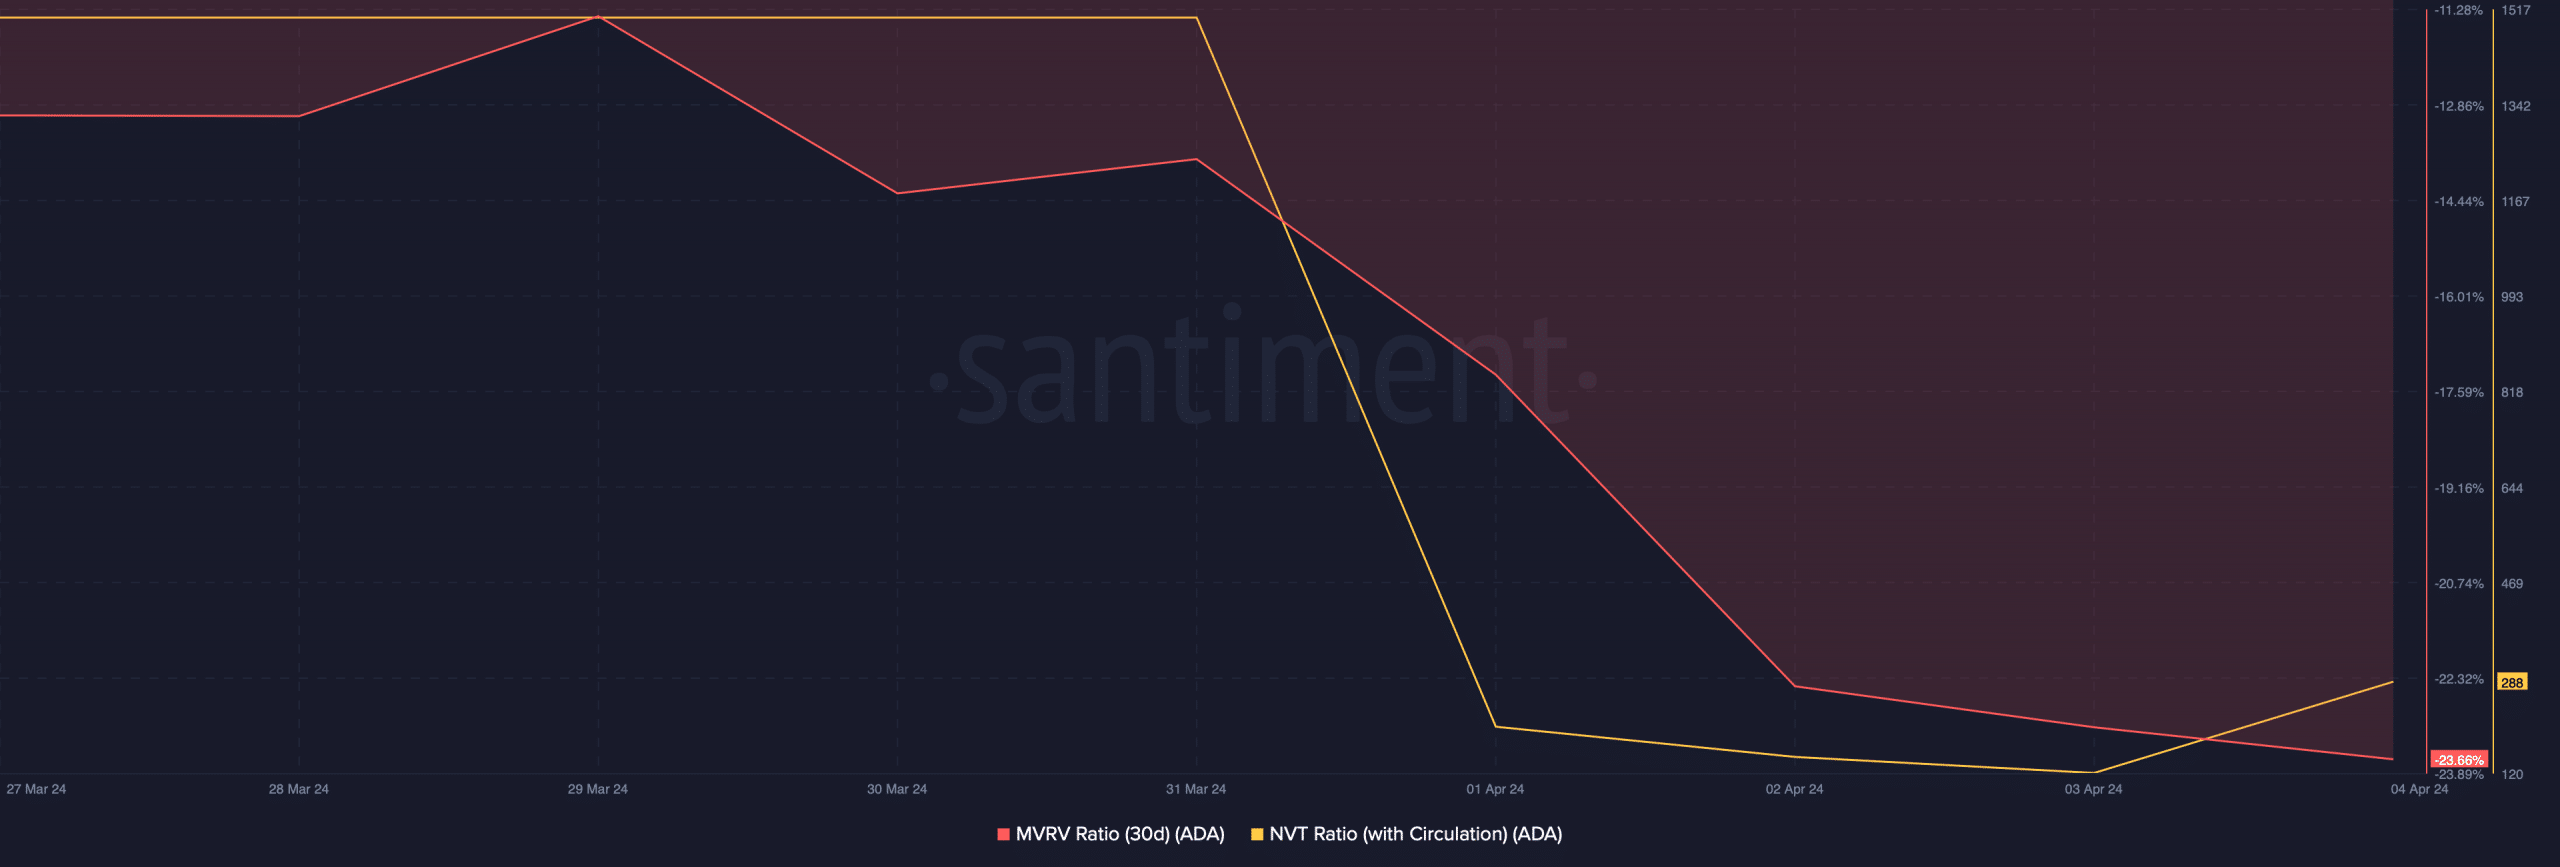
To better understand whether that was possible, AMBCrypto checked Cardano’s on-chain metrics. We found that ADA’s MVRV ratio had a reading of -23.6% at press time.
Such low MVRV ratios often trigger trend reversals. Additionally, its network-to-value (NVT) ratio registered a sharp downtick. Whenever the metric drops, it indicates that an asset is undervalued, hinting at a price uptrend in the coming days.

Source: Santiment
Read Cardano’s [ADA] Price Prediction 2024-25
Though the aforementioned metrics gave a bullish notion, technical indicators looked bearish on ADA. For instance, the MACD displayed a clear bearish upperhand in the market.
The Money Flow Index (MFI) registered a downtick and was headed further down from the neutral mark. Moreover, the Relative Strength Index (RSI) also followed a similar declining trend, further suggesting that the chances of a price decline were high.

Source: TradingView
Powered by WPeMatico


