- BTC ETFs ramped up accumulation despite recent drawdowns.
- Glassnode founders were bullish on BTC despite overhead obstacles on price charts.
Despite Bitcoin [BTC] declining by nearly 20%, U.S. spot BTC ETFs scooped the dip even though the largest digital asset dropped below $55K.
In June, BTC dropped from $71.9K to $58.4K. Further negative sentiment in July saw it drop to a new low of $53.4K before reclaiming $58K as of press time.
Bitcoin ETFs holding steady
While acknowledging the recent drawdown as “nasty,” Bloomberg ETF analyst Eric Balchunas noted that ETFs’ AUM (assets under management) and YTD (year-to-date) flows remained steady.
‘Bitcoin had 20% drawdown in a month flat. Pretty nasty. I would have been impressed if 90% of aum hung in there, but it was over 100% as they saw inflows…kept the all-important YTD net number at +$15B.’
Balchunas added that BTC ETFs’, which he equated to boomers’ holdings, were “hanging tough” during drawdowns.
Farside Investors data supported Balchunas’s statement, as YTD flows reclaimed the $15 billion mark after dropping to $14.3 billion in late June.

Source: Bitcoin ETF
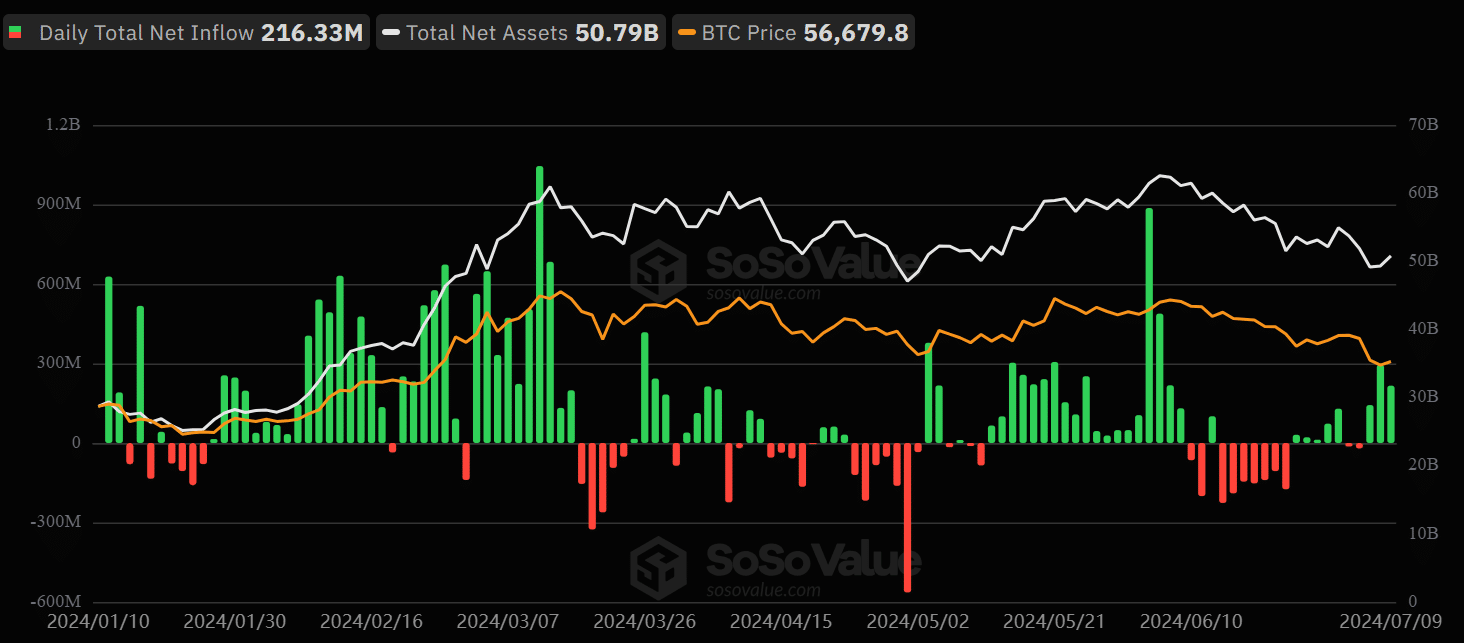
But Soso Value data revealed that BTC ETFs’ AUM declined by nearly $10B. Amidst recent drawdowns, it dropped from $62.5 billion to below $50 billion.
Community reactions on BTC ETFs
However, AUM has since recovered as flows improved at the start of the week. The products have seen positive net flows since last Friday.
On Monday and Tuesday, BTC ETFs saw $294.9 million and $216.3 million in inflows, respectively.
Nevertheless, other market observers viewed the improved ETF flows as irrelevant to BTC price action on the chart.
In fact, one user claimed the inflows were hedge funds to short BTC on the futures market through cash and carry trade.
Another market analyst, Jim Bianco, countered Balchunas’ boomer narrative in BTC ETFs.
Bianco underscored that boomers held a “tiny percentage,” with the majority of BTC ETF holders coming from ‘self-directed investors.’
How’s Bitcoin price action?

Source: BTC/USD, TradingView
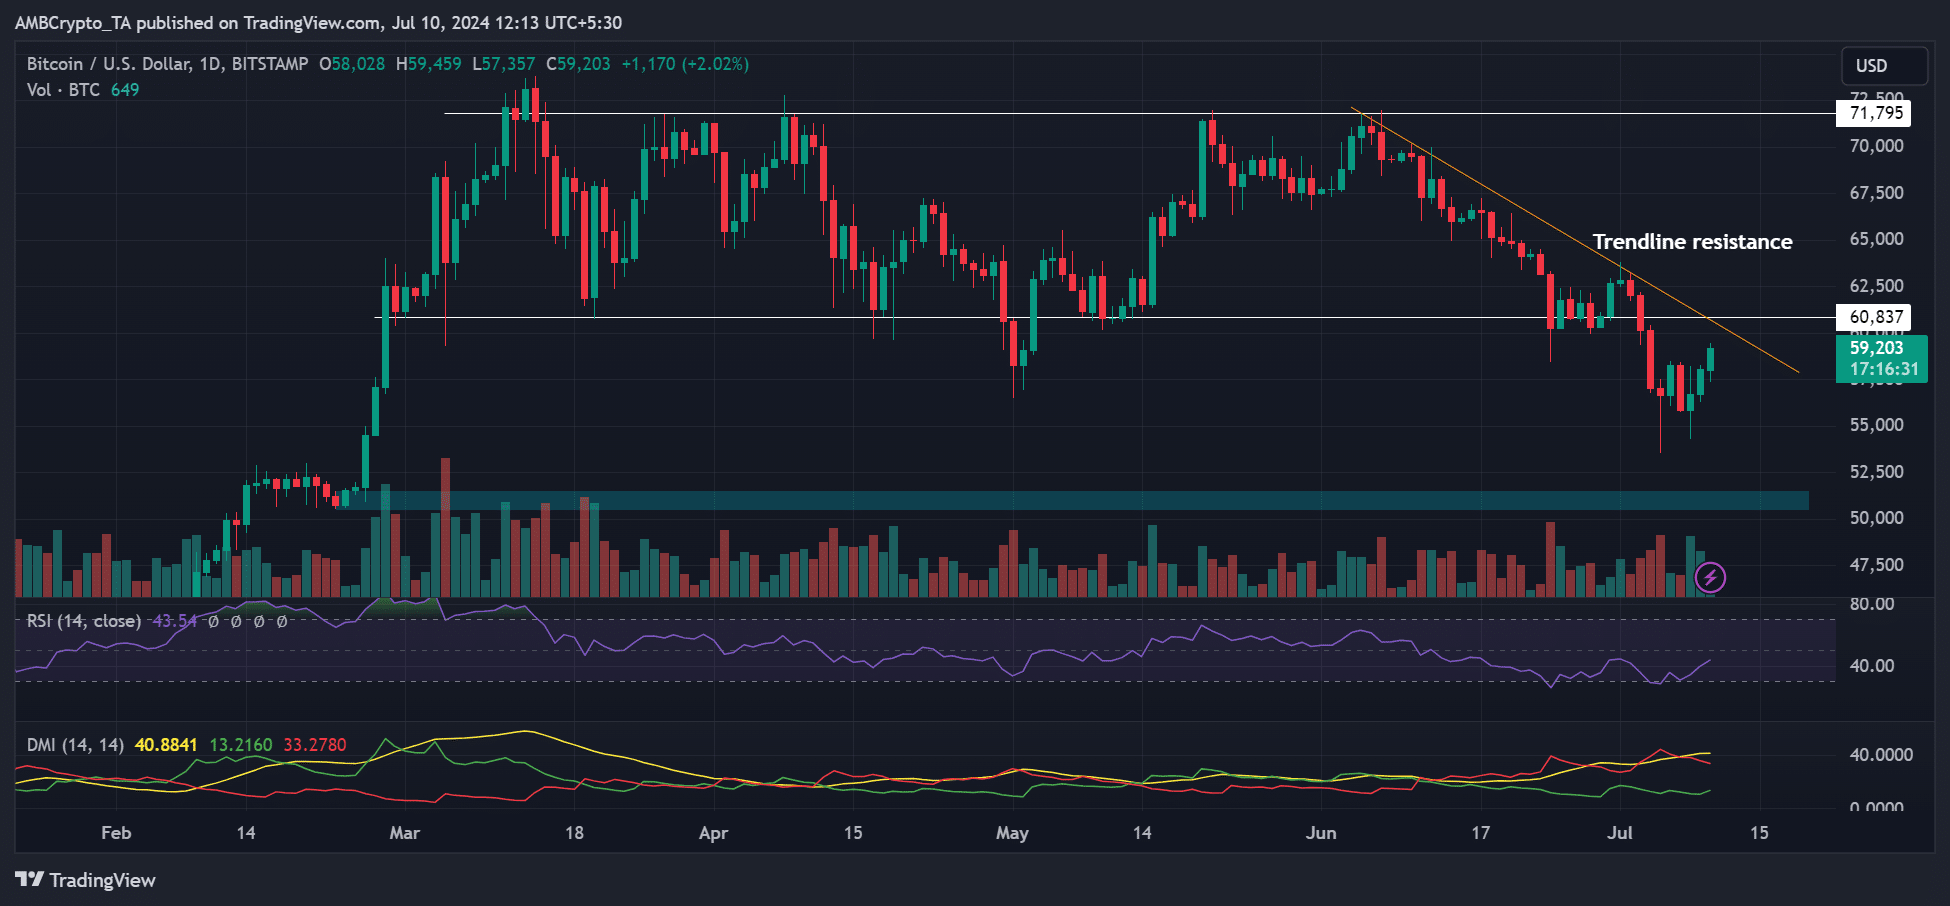
As of press time, BTC was up 5.8% on a weekly basis and slightly above $59K. However, to show further strength, the recovery must clear the trendline resistance and reclaim the range-low of $60.8K.
The RSI (Relative Strength Index) and the Directional Movement Index (DMI) showed remarkable positive strengthening.
However, RSI was below average, and DMI was far from a positive crossover, indicating that bulls still didn’t have absolute market leverage.
Interestingly, Glassnode founders, Negentropic, claimed that BTC’s RSI has bottomed on the daily chart, tipping them to take a bullish stance on BTC.
Powered by WPeMatico


