

XRP price has remained near $1.25 at the beginning of November, even as U.S. spot XRP exchange-traded funds reportedly attracted fresh investments during October’s cryptocurrency market decline.
Summary
- XRP price traded near $1.25 on November 2, following a monthly decline of nearly 16%.
- U.S. spot XRP ETFs reportedly attracted $18.83 million in October, their seventh consecutive positive month.
- Technical indicators remain bearish, with immediate support at $1.2323 and resistance near $1.2999.
- Analyst Carolina identified historically weak monthly RSI readings but said a recovery would require stronger buying activity.
- EGRAG Crypto’s historical analysis found that seven of the past 13 Novembers ended negative for XRP.
According to crypto.news price data, XRP traded around $1.25–$1.26 on November 2, with daily prices ranging between $1.24 and $1.26. The cryptocurrency has lost roughly 15% over the past month, leaving investors watching whether its recent sideways movement can develop into a recovery.
Despite the weakness, October’s reported ETF inflows suggest that some investors continued adding exposure through regulated investment products.
XRP ETFs attract $18.83 million despite October losses
U.S. spot XRP ETFs reportedly ended October with $18.83 million in net inflows, according to SoSoValue data.
The funds attracted $4.32 million during the final week of October, following approximately $4.25 million the preceding week. Those contributions helped offset withdrawals recorded earlier in the month.
Cumulative net inflows reportedly reached $1.81 billion, while October represented the seventh consecutive month with positive net subscriptions.
Bitwise led the funds with approximately $682 million in cumulative inflows. Franklin Templeton’s XRPZ followed with $524 million, ahead of Canary Capital’s XRPC at $485 million.
However, October’s $18.83 million was the second-lowest monthly inflow reported for the products, exceeding only January’s $15.59 million.
As crypto.news previously reported, XRP funds had already experienced weaker demand in mid-October, including $1.84 million in weekly withdrawals.
The October 12–16 outflows ended a 13-week streak of positive weekly subscriptions, although subsequent inflows helped the funds recover.
Meanwhile, XRP’s price continued falling, showing that positive ETF subscriptions did not translate into a sustained market recovery.
XRP price faces resistance near $1.30
On the daily XRP/USDT chart, the cryptocurrency traded near $1.2501, with technical indicators suggesting that sellers continued to hold an advantage.
The Bollinger Bands placed the 20-day moving average at $1.2999, above the current trading price. The lower band stood at $1.2323, while the upper band was positioned at $1.3675.
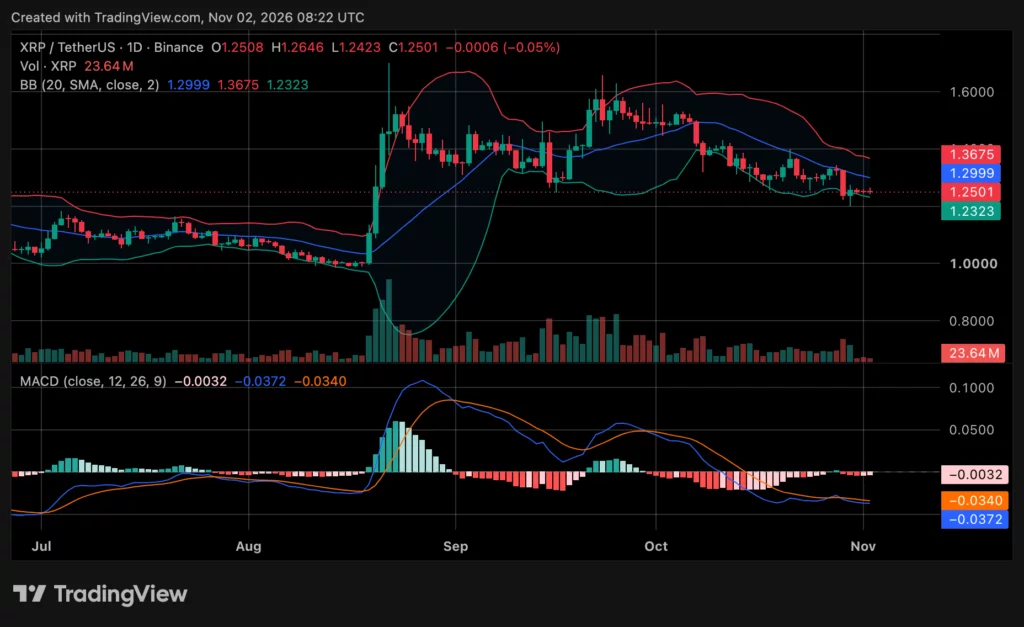
A move below $1.2323 would put the recent support area under pressure. Conversely, a recovery above $1.2999 would bring the middle Bollinger Band back into focus.
The Moving Average Convergence Divergence indicator remained negative, with the MACD line at -0.0372 and its signal line at -0.0340.
Its histogram registered -0.0032, showing that bearish momentum had not yet reversed.
Earlier analysis of XRP support identified weakness below key moving averages during October, before the cryptocurrency retreated toward $1.25.
Trading volume on the supplied daily chart stood at 23.64 million XRP, while the latest candles showed relatively small price changes.
Analysts examine XRP’s historical November performance
Crypto analyst Carolina discussed XRP’s monthly relative strength index, suggesting that the indicator was approaching levels associated with previous market turning points.
According to the analyst, similar oversold conditions have appeared several times during XRP’s 13-year trading history.
Carolina identified $1.50, $3.50, $7.00 and $14.00 as potential long-term targets, while acknowledging that higher prices would require stronger trading volume and fresh capital.
The analyst’s projections remain speculative, and an oversold RSI reading does not establish that a market bottom has formed.
Separately, EGRAG Crypto reviewed XRP’s historical October and November returns, describing October 2026’s 16% decline as its fourth-worst October since 2013.
His analysis found that seven of the 13 completed Novembers between 2013 and 2025 ended negative, while six recorded gains.
The historical average November return was reportedly 78.3%, compared with a median decline of 9.1%.
The difference came from several unusually strong months, including reported gains of 489.1% in 2013 and 282.9% in 2024.
EGRAG suggested that XRP could experience weakness during the first half of November before attempting a recovery later in the month.
However, the historical figures describe previous market performance and do not establish how XRP will trade during November 2026.
Whale activity adds another factor to XRP’s outlook
Recent large-holder activity has presented mixed evidence about investor positioning.
Earlier reporting on whale transfers showed that large XRP deposits to Binance had reached a seven-month high in October.
CryptoQuant analyst Darkfost reported that the monthly average value of large transfers reached $112.4 million, although deposits to exchanges do not prove that the tokens were sold.
Separate wallet data later indicated that the number of addresses holding between 10 million and 100 million XRP had fallen from 351 to 339.
Exchange balances reportedly grew by approximately 47 million XRP during the same period, according to data shared by analyst Ali Charts.
XRP’s immediate trading range remains centered around $1.25, with the November 2 technical chart placing the lower Bollinger Band at $1.2323 and the 20-day moving average at $1.2999.
Disclosure: This article does not represent investment advice. The content and materials featured on this page are for educational purposes only.
Powered by WPeMatico


