- Bitcoin neared a death cross at press time, suggesting possible further declines.
- Historical trends showed that recovery was possible post-death cross, as seen in 2020 and 2021.
Bitcoin [BTC] was trading at a price of $57,389 at press time.
This does not only marked a 3.9% increase in BTC’s price over the past day, but was also a notable rebound from BTC’s decline on the 5th of August, which brought its price to trade as low as $49,781.
Regardless of the gradual rebound in BTC’s price, at the time of writing, the asset was still down roughly 22.2% from its all-time high (ATH) above $73,000 in March.
Death cross looms over Bitcoin
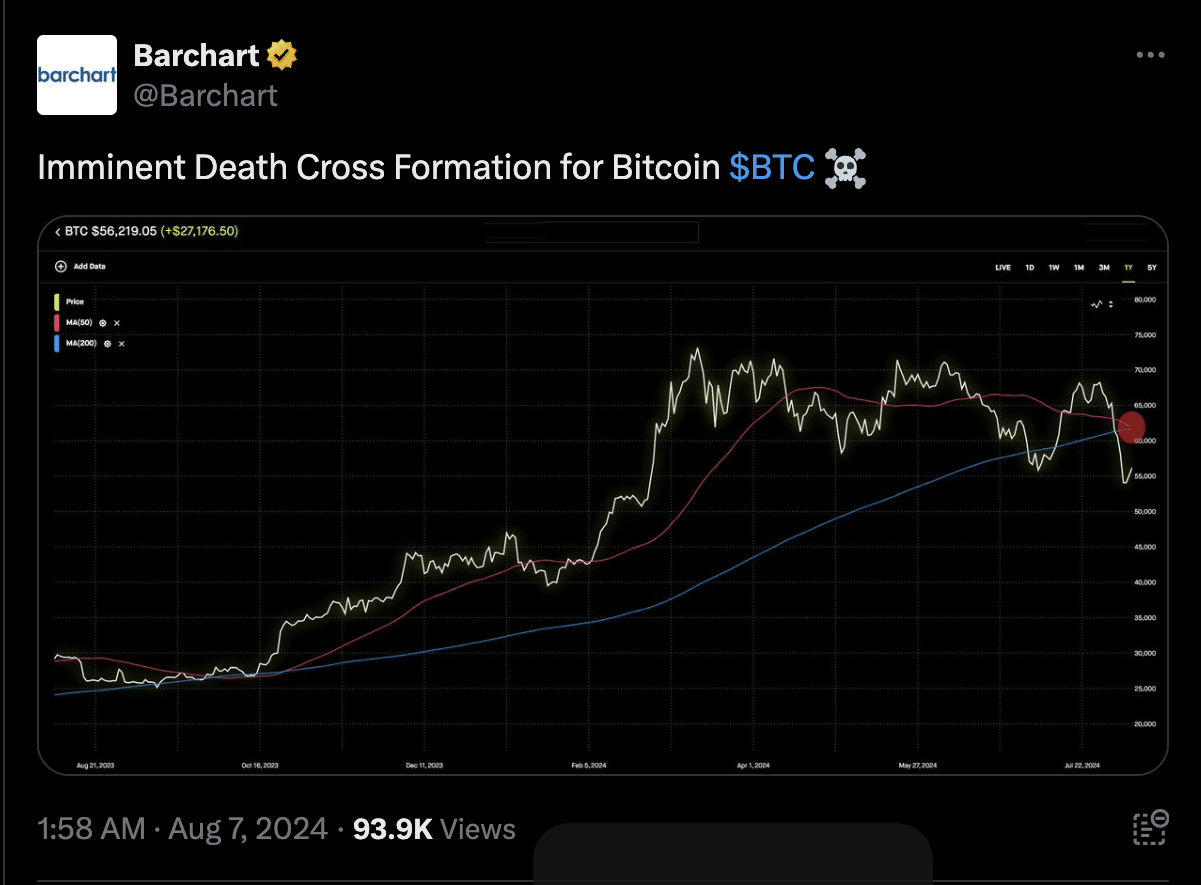
Amid this, Bitcoin appeared to be teetering on the edge of a technical configuration known as a “death cross.”
This term in trading refers to a scenario where the 50-day moving average drops below the 200-day moving average, traditionally a bearish indicator for traders.

Source: Barchart on X
According to data from Barchart, this pattern was emerging as Bitcoin’s short-term gains had not sustained above its long-term gains.
Historically, Bitcoin has faced similar patterns; for instance, a death cross occurred in March 2020, however, it was followed by a new all-time high later that year.
Another instance was noted in June 2021, which also preceded a significant rally to record levels.
While this may be a bearish indicator, if historical scenario is to go by, then BTC may as well be on the verge of a breakout to the upside.
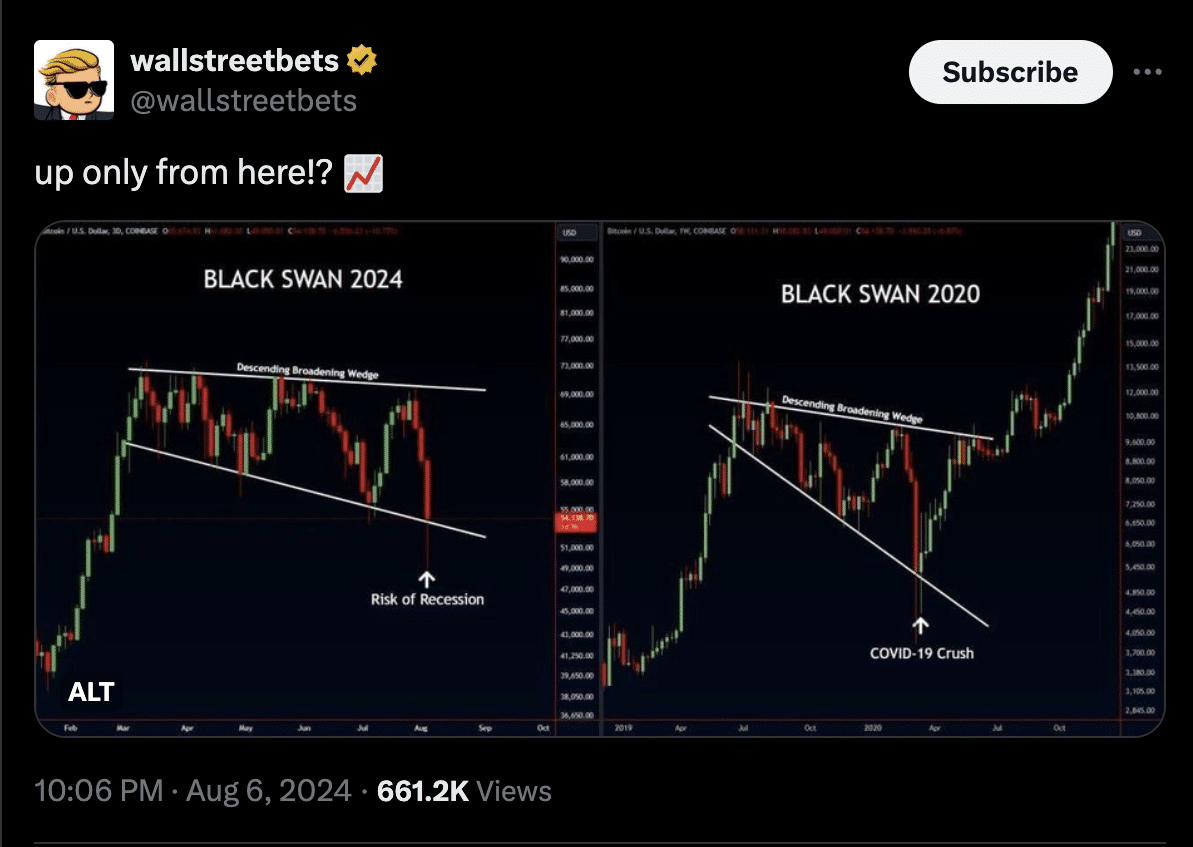
Adding to this sentiment, a notable crypto enthusiast known on X (formerly Twitter) as ‘walltreetbets’ has highlighted a compelling pattern in Bitcoin’s chart.
This pattern closely mirrored the one seen in 2020, when Bitcoin fell into a descending broadening pattern during the COVID-19 crash, only to rebound sharply from below $5,000 to over $20,000.

Source: wallstreetbets on X
According to Wallstreetbets’ analysis, the 2024 chart suggested a similar trend.
Bitcoin has formed another descending broadening pattern amidst the recent economic downturn and seemed to have bottomed out, setting the stage for a potential surge akin to the recovery observed in 2020.
Fundamental outlook
Aides technical analysis, examining Bitcoin’s fundamentals can also provide insight into its future direction.
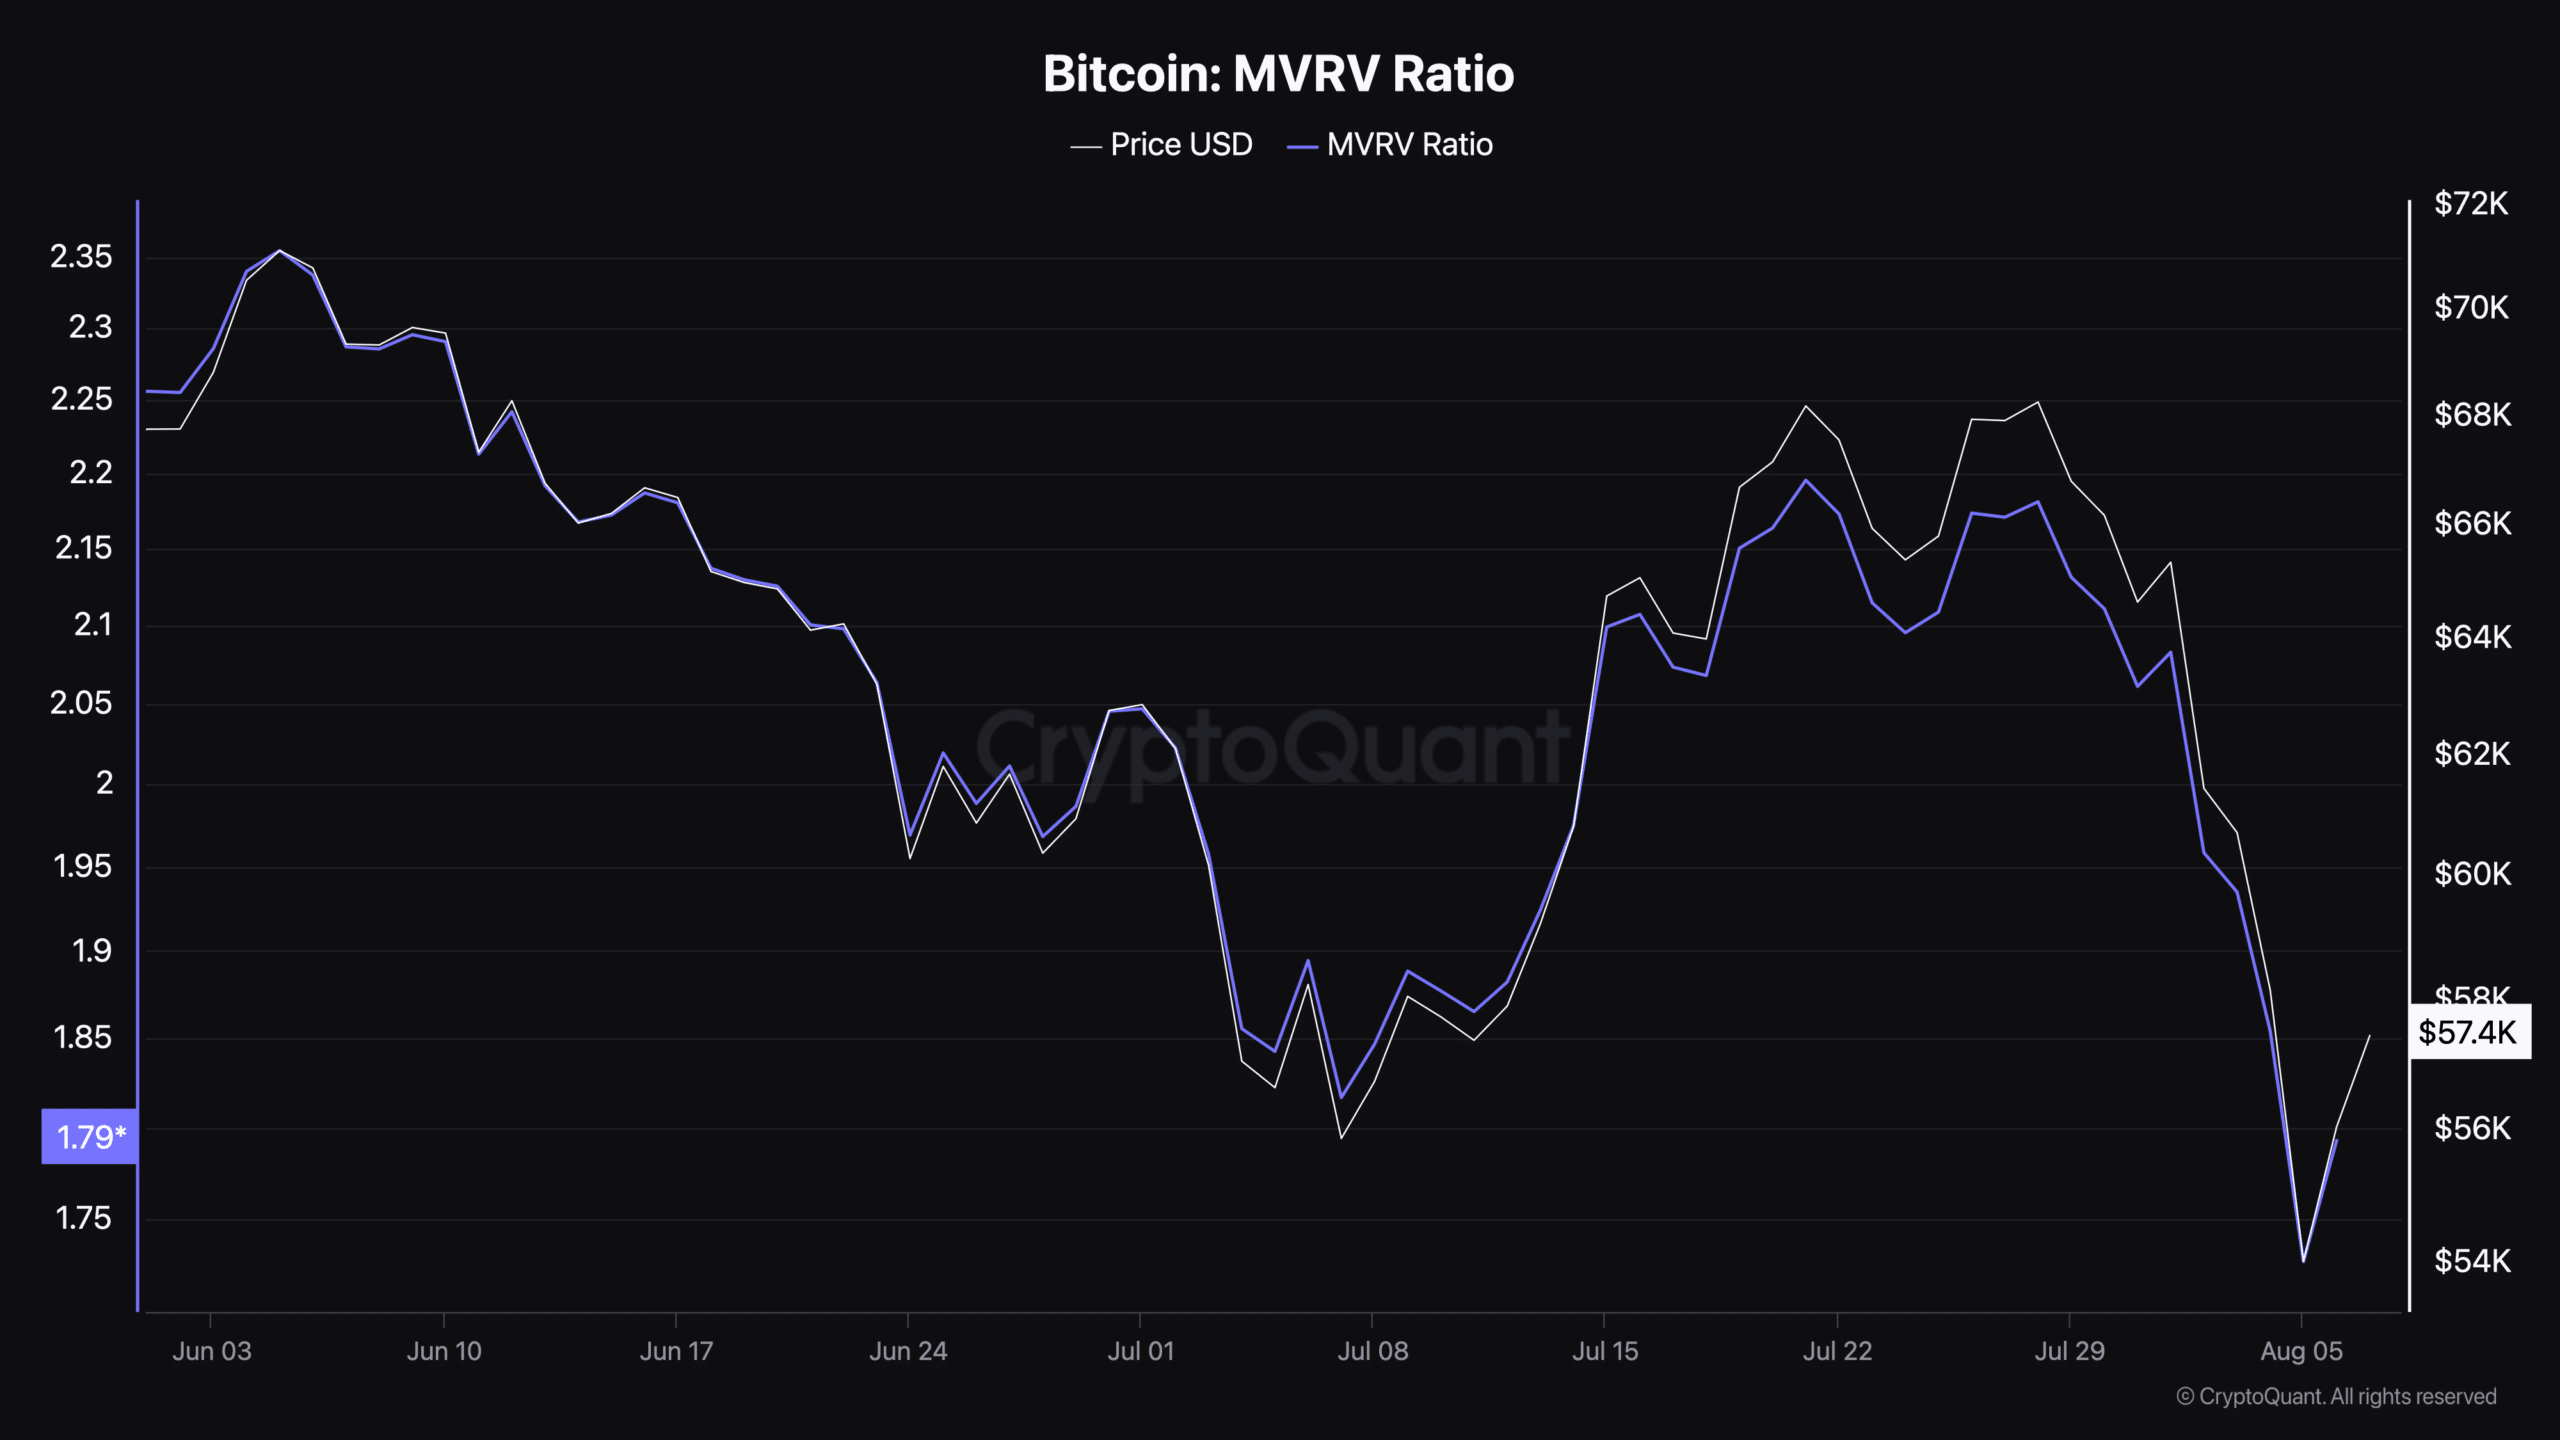
Notably, Bitcoin’s Market Value to Realized Value (MVRV) ratio, which measures the discrepancy between market price and actual value, was 1.79 at press time.

Source: CryptoQuant
This ratio suggested that Bitcoin was undervalued at the time of writing, as a value below 2 often indicates that the asset was trading below its fair value, presenting a potential buying opportunity.
Additionally, Bitcoin’s Open Interest, representing the total number of outstanding derivative contracts like Futures and options that have yet to be settled, rose by 3.81% in the past 24 hours to $28.24 billion.

Source:: Coinglass
Is your portfolio green? Check out the BTC Profit Calculator
Despite this increase, the Open Interest volume saw a significant decline of 48%, standing at $80.12 Billion at press time.
This divergence typically indicates that while more contracts are open, the overall value of trading has decreased, suggesting a cooling off in market momentum or a shift in trader sentiment.
Powered by WPeMatico


