- BOME holds key support, with bullish patterns hinting at possible breakout in coming sessions.
- Market sentiment remains cautious yet optimistic as BOME eyes critical resistance for trend reversal.
Book of Meme [BOME] has experienced a volatile week, standing at $0.008752 at the time of this writing. This represents a -1.60% decline over the last 24 hours and a -1.36% decline over the past week. With a circulating supply of 69 billion BOME, the current market capitalization is valued at approximately $603.8 million.
Despite the recent price decline, BOME has managed to hold above a key support level, which could play a crucial role in its potential recovery.
The 24-hour trading volume is reported at $361.7 million, while open interest stands at $89.96 million, reflecting a -1.58% decrease in open interest, according to Coinglass data.
Bullish patterns developing amid consolidation
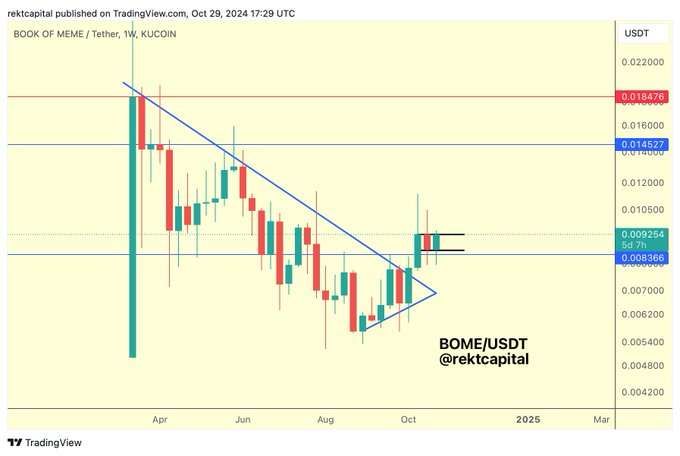
BOME’s technical chart displays a potential Bull Flag formation, which indicates a pause before a possible upward continuation. The price recently managed to retest the blue range low at $0.00836 as support, suggesting potential for further upside if the pattern confirms.
According to Rekt Capital, a successful breakout from this pattern could lead to further gains, positioning BOME to climb within its broader trading range.
The token recently broke above a descending trendline that stretched from April to mid-September, signaling the possibility of a trend reversal.
Additionally, there was a symmetrical triangle breakout observed, which typically points to a shift from consolidation to a new trend. Analysts are closely monitoring whether the price can sustain these levels, as it could pave the way for further growth.
Key levels to watch for price continuation
Support is currently positioned at $0.00836 (blue line), while immediate resistance is seen at $0.009925 (black line). Should BOME manage to clear this resistance, it could target the next level at $0.014527.

Source: X
On the downside, a break below the current support may lead to a retest of lower levels, which could trigger further consolidation.
The recent price action suggests that $0.009254 is a critical level to watch. A weekly close above this mark may indicate continued bullish momentum. In the longer term, the next major resistance at $0.018476 could serve as a significant target if the broader trend remains positive.
Moving averages and RSI indicate neutral momentum
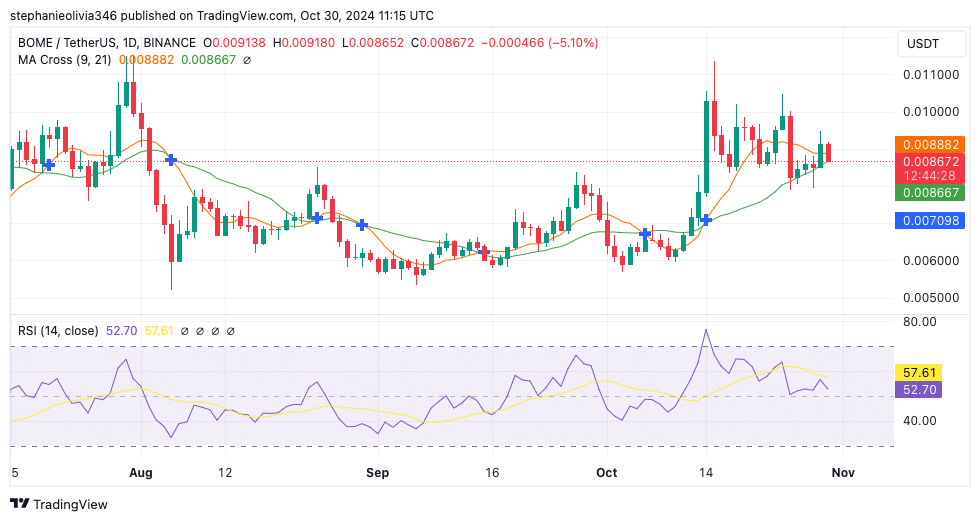
The 9-day and 21-day moving averages show a bullish crossover, signaling potential upward momentum. However, the 9-day moving average is currently being tested as dynamic support.
A close below the 21-day moving average could signal a shift in momentum, indicating possible short-term weakness.

Source: TradingView
The Relative Strength Index (RSI) is at 52.63, reflecting neutral momentum. This mid-range RSI reading suggests consolidation, leaving room for both upward or downward movement.
RSI above 57.60 could confirm renewed bullish strength, while a drop below 50 might indicate increasing selling pressure.
Read Book of MEME’s [BOME] Price Prediction 2024-25
Market sentiment and outlook
Despite recent declines, the market is cautiously optimistic about BOME’s potential for recovery, provided it can maintain current support levels.
With a daily trading volume of over $361 million, there is still active participation from traders, suggesting that the token remains on the radar of investors.
Powered by WPeMatico


