

Volatility is one of Bitcoin’s most important characteristics, but also one of the most difficult to manage for traders. The Average True Range (ATR) is an indicator that makes it possible to measure it and turn it into precise operational rules. Let’s see how it works and how it can be used within a trading system.
Bitcoin is a market that can alternate between periods of relative calm and phases characterized by very large price moves. Daily swings of several thousand dollars are not necessarily an exceptional event, especially when volatility increases.
For a systematic trader, this characteristic is both an opportunity and a problem. On the one hand, price movements create trading opportunities. On the other hand, they make it difficult to establish when to enter the market, where to place a stop loss and how much capital to allocate to each trade. This is precisely where the Average True Range, commonly abbreviated as ATR, comes into play.
What is the Average True Range and how is it calculated
The Average True Range (ATR) is a technical indicator that measures the average size of price swings of a financial instrument. It was developed by J. Welles Wilder in 1978 with the aim of measuring volatility. Unlike other indicators, such as moving averages or MACD, ATR does not try to identify the direction of the market. It therefore does not tell us whether Bitcoin will rise or fall, but how wide its price movements have been on average.
Its functioning starts from the so‑called True Range, which represents the largest price excursion considering three values: the difference between the candle’s high and low, the distance between the high and the previous close, and that between the low and the previous close. This calculation method makes it possible to take into account any price gaps between one candle and the next. ATR is then obtained through a smoothed average of the True Range. The most commonly used parameter is 14 periods, although it can be modified depending on operational needs.
For example, if on Bitcoin’s daily chart the 14‑period ATR is equal to 2,500 dollars, it means that the recent daily range, measured via the True Range, is around this value.
However, be careful: this does not mean that Bitcoin must necessarily move by 2,500 dollars the following day. ATR describes observed volatility, not future volatility. When the indicator increases, it means that swings are becoming wider. When it decreases, the market is going through a phase of lower volatility.
Why use ATR to measure Bitcoin’s volatility
The cryptocurrency market has some characteristics that make an indicator like ATR particularly useful. First of all, Bitcoin is traded 24 hours a day, seven days a week. There is no weekly close comparable to that of traditional stock markets, and changes in volatility can occur at any time, even during the weekend.
In addition, volatility is not constant over time. A 2% stop loss, for example, might be sufficiently wide during a calm phase, but turn out to be too tight when the market is going through a particularly turbulent period. Always using the same percentage distance means ignoring the context in which one is operating. ATR instead makes it possible to build rules that can automatically adapt to market conditions. Let’s look at some concrete applications.
How to use ATR to calculate the stop loss and the amount to buy
One of the most immediate applications concerns the placement of stop losses. Let’s suppose we buy Bitcoin at 90,000 dollars, with a daily ATR of 2,000 dollars. We could decide to place the stop loss at a distance equal to twice the ATR, therefore 4,000 dollars below the entry price, at 86,000 dollars.
If instead the ATR were 3,500 dollars, the same rule would place the stop at 83,000 dollars. In this way, the stop distance adapts to the current volatility, rather than being established arbitrarily. Naturally, a more distant stop implies a larger potential loss for the same purchased amount. For this reason, ATR can also be used for position sizing.
Let’s imagine we have capital of 20,000 dollars and want to risk at most 1% per trade, i.e. 200 dollars. With a stop 4,000 dollars away from the entry price, the theoretical amount that can be bought would be:
200 / 4,000 = 0.05 BTC
If volatility were to increase and the stop had to be widened to 7,000 dollars, the amount would fall to about 0.0286 BTC.
The principle is simple: when volatility increases, exposure is reduced. When it decreases, it is possible to increase it, always respecting the established risk limits. These calculations are theoretical and do not include commissions, slippage and any differences between the stop price and the execution price.
Breakout strategy on Bitcoin with ATR: rules and backtest
Let’s now try to build a simple trading system that uses ATR not only for risk management, but also to identify potential trading signals. The idea is to exploit phases in which Bitcoin breaks through a significant price level, trying to participate in a possible directional move. It is therefore a simple trend‑following strategy on the long side, designed for the spot market but also applicable to futures.
The session considered conventionally goes from 00:00 to 23:59 GMT, to make it coincide with the calendar day, since cryptocurrencies are quoted 24 hours a day. A 15‑minute bar chart will also be used to operate fairly precisely in the market, but also using a second data series (data2) with daily bars for calculating the entry level.
This level is obtained by adding to the close of the last daily bar a certain amount determined via the Average True Range (ATR) of the last 5 days (period), multiplied by a factor (factor) that will initially be set equal to 1.
buy next bar at c data2 + factor*AvgTrueRange(period)data2 stop;
Assuming we trade with 10,000 dollars per position, the trade will be closed upon reaching a stop loss of 1,000 dollars, a fairly wide value but assumed to be necessary in this market, and to be checked later with an optimization. The strategy has an intraday horizon, so it will close positions at the end of the session if necessary, without the need to use a take profit.
By applying this strategy on the Bitcoin (BTC) spot market against USDT (stablecoin pegged to the dollar), from January 2018 to October 2026 we obtain very encouraging results, with an equity line that rises fairly steadily.
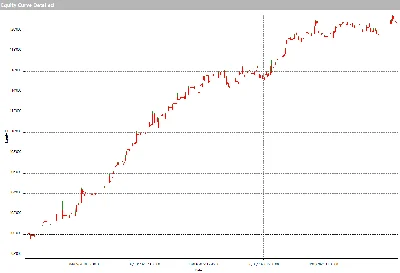
Figure – Equity line of the breakout strategy on BTC/USDT with ATR, before optimization.
This is confirmed by the annual results shown in Figure 2, which however show an average trade of about 46 dollars, not very consistent over the years, and which could be improved in order to make the strategy more robust with a view to supporting the operating costs of real trading.
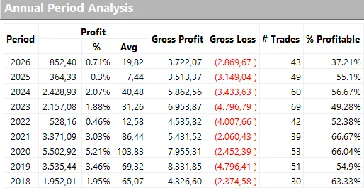
Figure – Annual results of the breakout strategy on BTC/USDT before optimization, from January 2018 to October 2026.
Optimization of the ATR period, the multiplier and the stop loss
Among the variables on which one can work to optimize the strategy there is certainly the period over which ATR is calculated, but also its multiplicative factor (factor).
By varying the ‘period’ between 2 and 10 days, and the ‘factor’ between 0.1 and 2 (in steps of 0.1), while leaving the stop loss unchanged for the moment, we obtain the results shown in Figure 3.
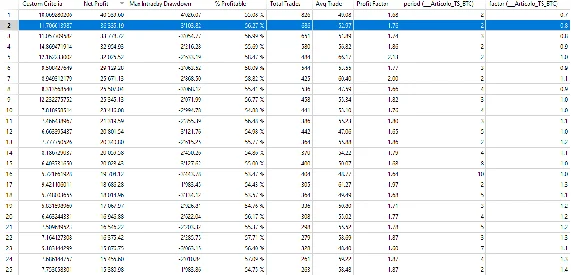
Figure – Optimization of the ATR period and multiplicative factor.
Sorting them by Net profit, and filtering only the results that improve the initial average trade, we can note for example the combination ‘period’=2 and ‘factor’=0.8, which makes it possible to increase net profit with a good Net Profit/Drawdown ratio.
An excellent result, but that does not mean we cannot work further to improve it. At the moment, in fact, the strategy provides for the use of a 1,000‑dollar stop loss, i.e. 10% of the position value, which has not been optimized. In Figure 4 we can see that by varying the stop loss from 0 to 2,000 dollars, values around 300 dollars (3%) make it possible to improve the overall metrics.
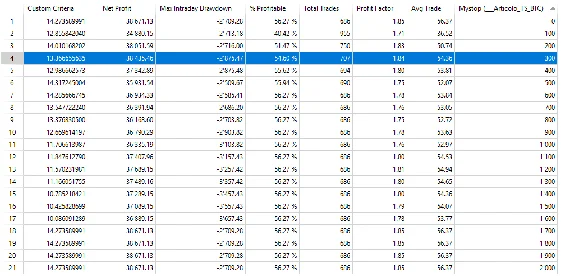
Figure – Optimization of the stop loss.
Figure 5 shows the equity curve of the final strategy, which is certainly interesting in its simplicity and potentially applicable to many other cryptocurrencies, with the necessary adjustments and optimizations.
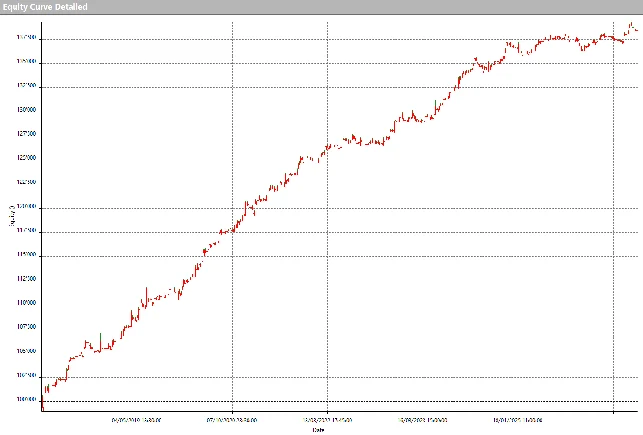
Figure 5 – Equity line of the breakout strategy on BTC/USDT after optimizing the ATR and stop loss parameters.
The limits of ATR and the importance of backtesting
Like all indicators, ATR also has its limits. The first is that it measures past volatility. A sudden increase in swings can make previously calculated levels inadequate.
The second is that it does not distinguish between favorable and unfavorable moves. A high ATR can accompany both a strong rally and a violent decline.
Finally, using ATR does not automatically guarantee better performance. An adaptive stop (not used in the previous example) could reduce premature exits, but also increase the average loss of losing trades. A rigorous test should verify its behavior over periods not used to choose the parameters (our example should be validated from November 2026 onward), avoiding building a system that is perfectly adapted to the past but unable to function in the future.
From volatility to trading rules
The real value of the Average True Range therefore does not lie in its ability to predict Bitcoin’s next move, but in the possibility of transforming a market characteristic, volatility, into measurable and repeatable rules that make it possible to reduce the discretionary component of decisions.
This is one of the fundamental principles of systematic trading: not trying to guess every price move, but building a coherent set of rules, checking their behavior on data and applying them with discipline. ATR alone does not constitute a profitable trading system. It can, however, become a valuable tool within a structured strategy, especially in a dynamic and volatile market like Bitcoin’s.
Powered by WPeMatico


