- XRP faced high selling volume, but there’s reason for bulls to be upbeat.
- Traders might smell opportunity with prices at a key HTF level.
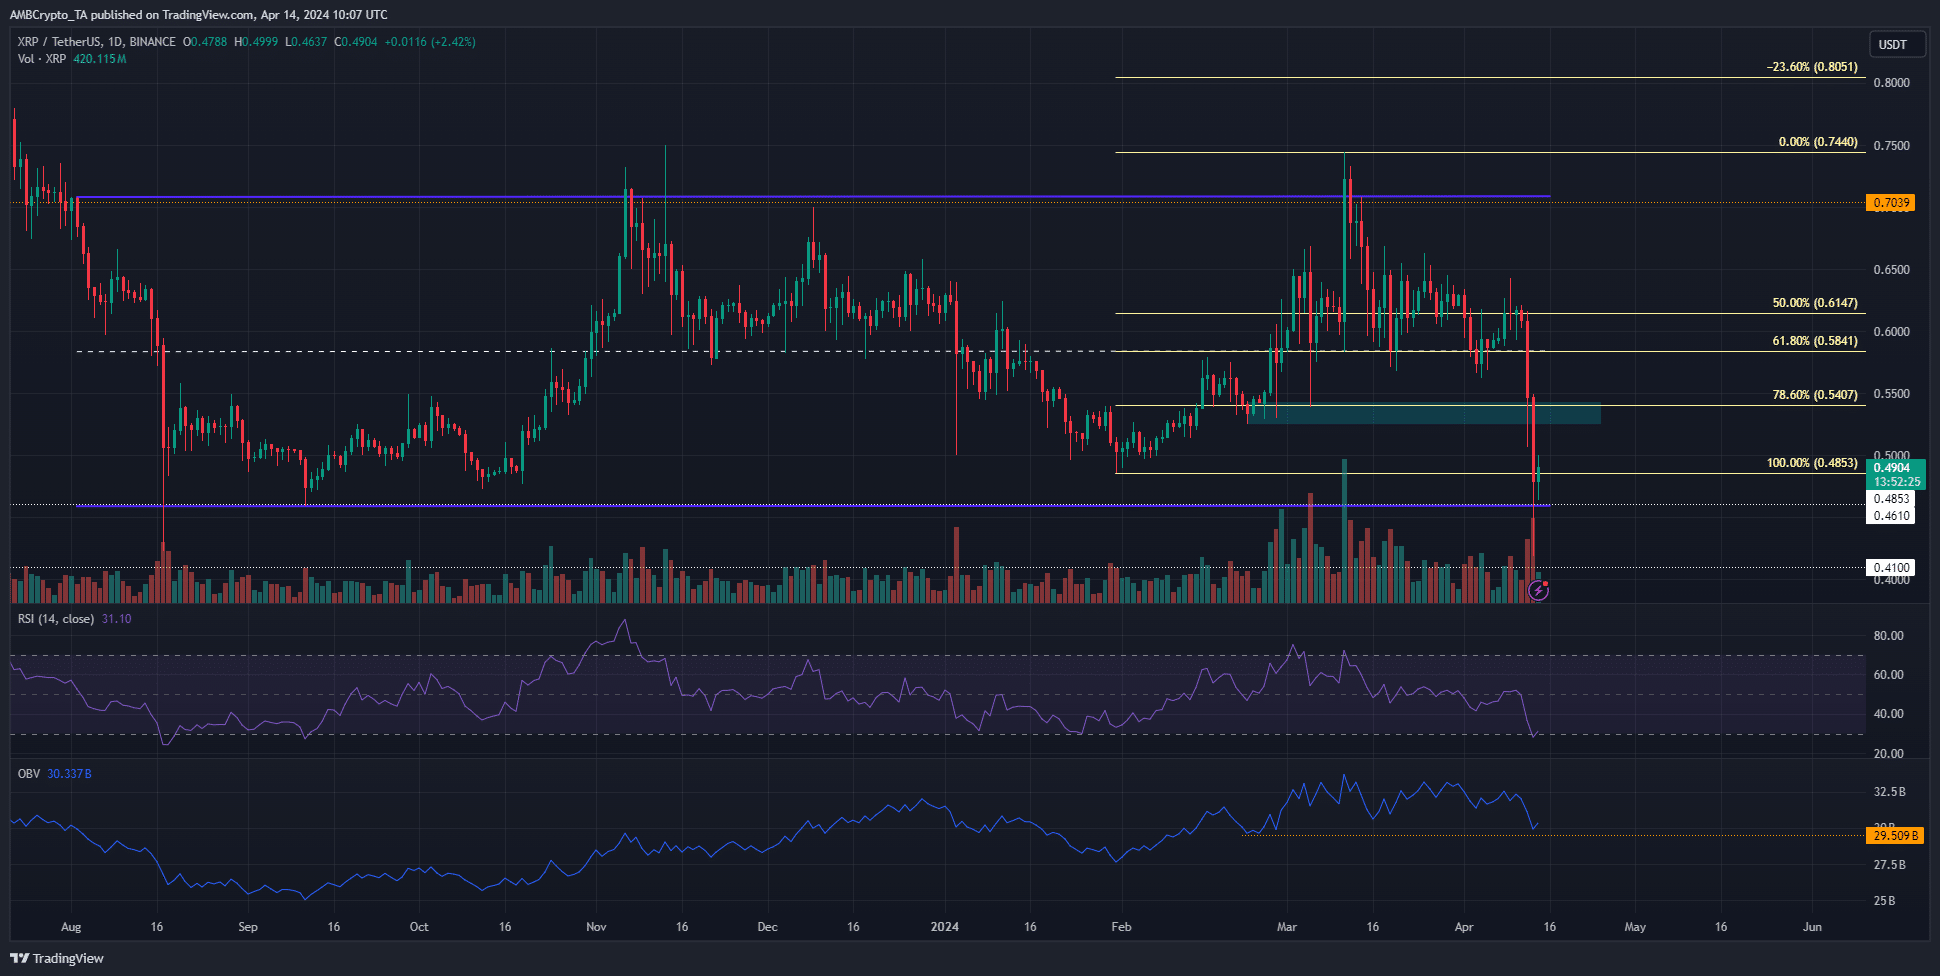
Ripple [XRP] saw a dump of enormous proportions- a 32% drop from the 11th to the 13th of April. It was the biggest, quickest plunge of 2024, taking prices well below the $0.54 demand zone.
Despite the intense pressure, the bulls might have some reason to be optimistic.
Swing traders and investors should note that XRP was trading just above a higher timeframe support level at $0.46. Could this see resilient XRP bulls, even if Bitcoin [BTC] decides to drop once more later this month?
The range lows retested once again

Source: XRP/USDT on TradingView
XRP saw its market structure flip bearishly when prices dropped below the $0.525 mark. The selling pressure forced it below the swing low at $0.485 as well.
There was good news for the buyers amidst all this chaos.
The 8-month range (purple) has its low at $0.46 and has not visited it since September 2023. Therefore, it likely represented a good buying opportunity from a risk-to-reward perspective.
The OBV agreed with this, showing that the low from late February had not been breached yet. It signaled that the selling volume has not taken over the buying volume of recent months.
Until it does, the bulls have some reason to hope for a recovery.
The RSI was at 31 and was an inch away from falling into the oversold territory. It does not signal an imminent reversal but underlined extreme selling momentum in recent days.
XRP sentiment was bleak, to put it mildly

Source: Coinalyze
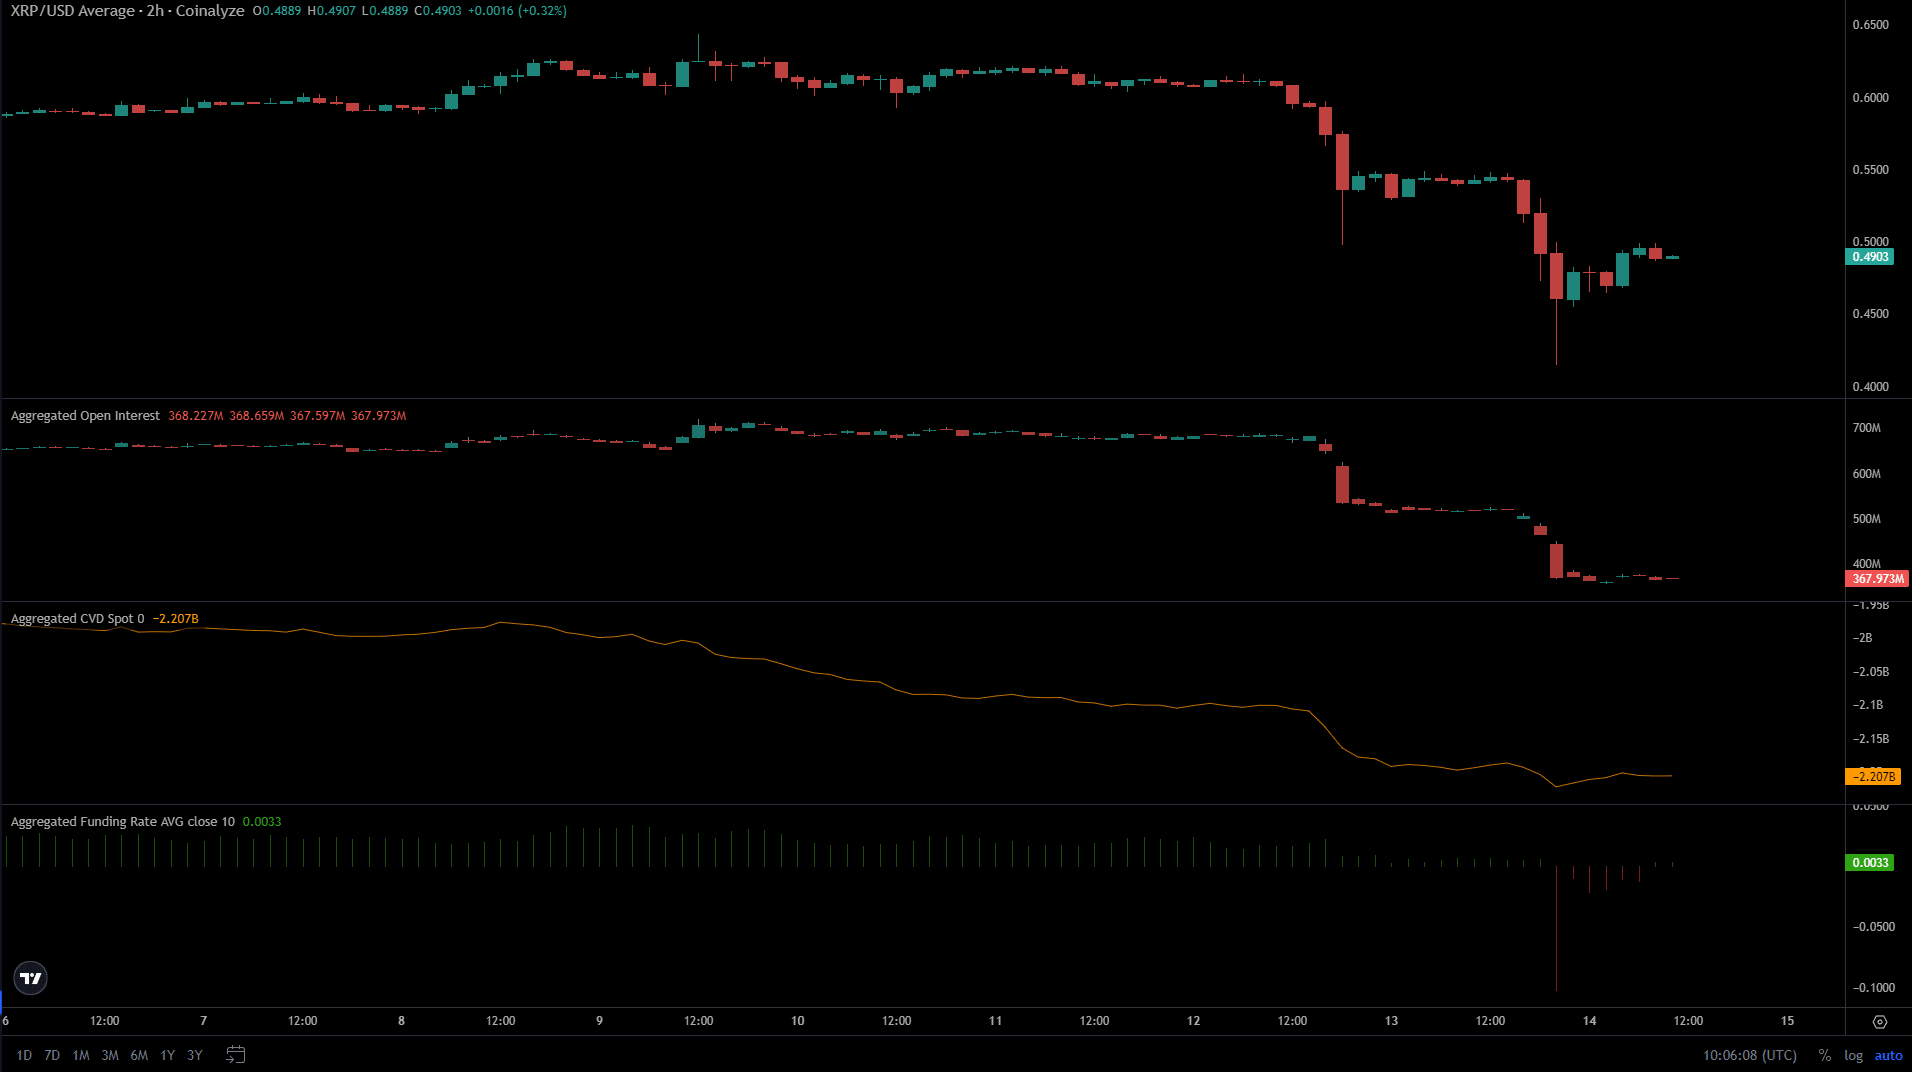
Coinalyze data revealed that the bears were dominant in April. The Open Interest fell from $680 million on 12th April to $367 million at press time.
The funding Rate had been negative in the past 24 hours, but was slowly climbing above 0.
Meanwhile, the spot CVD has been in a downtrend over the past week, and the recent losses accelerated this trend.
Realistic or not, here’s XRP’s market cap in BTC’s terms
The market sentiment did not suggest a quick recovery was likely. The lack of demand in the spot markets was especially discouraging for investors.
A change in the spot CVD and OI downtrend could be a sign of a bullish spark.
Disclaimer: The information presented does not constitute financial, investment, trading, or other types of advice and is solely the writer’s opinion.
Powered by WPeMatico


